Get Complete Analysis Of The Report - Download Updated Free Sample PDF
The growth of the Global Microalbumin Control Market is driven by rising prevalence of diabetes and chronic kidney disease, increasing demand for early detection and monitoring of renal complications, growing adoption of automated laboratory testing, stringent regulatory requirements for accurate diagnostics, and expanding awareness of preventive healthcare, which collectively boost demand for reliable microalbumin control materials.
The Global Microalbumin Control Market has witnessed trends toward automation, standardization, and high-precision diagnostic solutions. Laboratories increasingly prefer standardized control materials to ensure accurate and reproducible microalbumin testing. Rising integration of microalbumin testing into routine health screenings, alongside the development of multiplex assays and point-of-care testing, is shaping market growth. Technological advancements such as improved assay sensitivity, digital monitoring, and compatibility with automated analyzers are enabling faster and more reliable results.
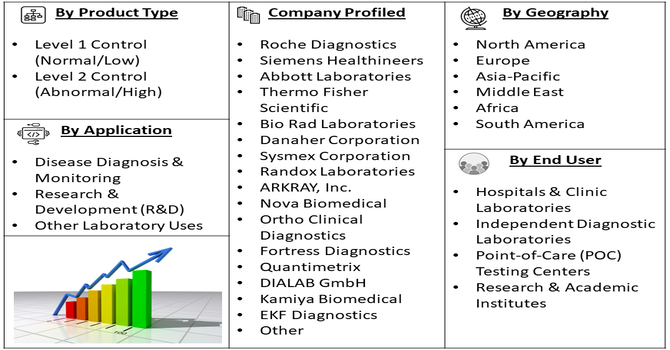
Segmentation: The Microalbumin Control Market is segmented by Product Type (Level 1 Control (Normal/Low) and Level 2 Control (Abnormal/High)), Application (Disease Diagnosis & Monitoring, Research & Development (R&D), and Other Laboratory Uses), End-User (Hospitals & Clinic Laboratories, Independent Diagnostic Laboratories, Point-of-Care (POC) Testing Centers and Research & Academic Institutes), and Geography (North America, Europe, Asia-Pacific, Middle East and Africa, and South America). The report provides the value (in USD million) for the above segments.
For Detailed Market Segmentation - Get a Free Sample PDF
Market Drivers:
The primary driver of the global microalbumin control market is the increasing prevalence of diabetes and chronic kidney disease worldwide. For instance, in 2025, GAVI Alliance, reported that, between 2005 and 2015 alone, chronic kidney disease of unknown aetiology was estimated to have affected 34000 people. Similarly, in 2025, National Kidney Foundation, reported that, diabetes is the most common cause of kidney disease. Diabetes and hypertension cause or contribute to 2 of 3 new cases of kidney failure.
Early detection of microalbuminuria is critical for monitoring renal health and preventing complications, which drives laboratories and healthcare facilities to adopt standardized microalbumin control materials. Growing awareness of preventive healthcare, routine screenings, and government initiatives for diabetes and kidney disease management further supports market growth. As the number of patients requiring frequent monitoring rises, the demand for reliable, accurate, and reproducible control materials strengthens, expanding adoption across diagnostic laboratories and healthcare institutions globally.
Another key driver is the rising adoption of automation and high-precision diagnostic technologies in clinical laboratories. Modern microalbumin control materials are designed for compatibility with automated analyzers, offering reproducible results and reducing human error. Integration of digital monitoring, multiplex testing, and high-sensitivity assays has improved testing efficiency and reliability, encouraging laboratories to invest in quality control products.
In January 2025, Prantae Solutions’ seed funding enabled the development of advanced point-of-care diagnostics for conditions like CKD and preeclampsia. This innovation accelerated technological advancements and automated testing in clinical laboratories, driving demand for reliable microalbumin control materials and positively influencing the growth of the global microalbumin control market. The shift toward standardized, automated workflows in diagnostic testing, combined with increased emphasis on laboratory accreditation and compliance with international standards, has significantly boosted the demand for microalbumin control materials across hospitals, research centers, and commercial diagnostic laboratories globally.
Market Restraints:
A major restraint is the high cost of advanced microalbumin control materials and limited awareness of their importance in emerging markets. Small clinics and laboratories may find the investment in standardized controls prohibitive, leading to continued reliance on manual or less precise testing methods. Additionally, insufficient knowledge about the benefits of using high-quality control materials for accurate microalbumin testing slows adoption in regions with underdeveloped healthcare infrastructure. Regulatory differences, lack of trained personnel, and budget constraints further restrict market penetration.
The market has a significant socioeconomic impact by supporting early diagnosis and monitoring of kidney disease and diabetes, which reduces healthcare costs and improves patient outcomes. Reliable microalbumin control materials ensure laboratory accuracy, minimizing misdiagnoses and unnecessary treatments. Early detection of renal and metabolic disorders improves workforce productivity and reduces the economic burden on healthcare systems. By promoting preventive healthcare and standardized laboratory practices, the market contributes to public health improvements. It also supports the growth of diagnostic laboratories, employment in clinical diagnostics, and investment in healthcare infrastructure, thereby having a positive ripple effect on socioeconomic development globally.
Segmental Analysis:
The Level 1 Control (Normal/Low) segment is expected to witness the highest growth over the forecast period as it is critical for routine laboratory calibration and quality assurance. These controls help laboratories validate assay accuracy for healthy or near-normal microalbumin levels, ensuring reliable detection of early-stage kidney disease. Increasing routine screenings for diabetes and renal complications, along with growing adoption of automated analyzers, has driven demand for Level 1 controls. Their affordability, widespread applicability, and essential role in maintaining laboratory standards make this segment the fastest-growing in the global microalbumin control market.
The disease diagnosis and monitoring segment is projected to witness the highest growth due to the rising prevalence of diabetes, hypertension, and chronic kidney disease. Microalbumin testing is crucial for early detection, disease progression monitoring, and therapeutic management. Healthcare providers are increasingly adopting standardized control materials to ensure test accuracy and regulatory compliance. The integration of automated analyzers and point-of-care testing has further expanded the use of microalbumin controls for ongoing patient monitoring. As awareness of preventive healthcare grows, the demand for reliable disease diagnosis and monitoring tools continues to drive market expansion globally.
Point-of-care (POC) testing centers are expected to witness the highest growth as they offer rapid, convenient, and accessible microalbumin testing outside traditional laboratories. Rising demand for early kidney disease detection and home-based monitoring has prompted healthcare providers to implement standardized microalbumin controls in POC settings. These controls ensure test reliability and accuracy, critical for clinical decision-making. The adoption of compact, automated analyzers and portable testing devices has accelerated POC utilization. As patient awareness and government initiatives supporting decentralized healthcare increase, the segment’s contribution to the global microalbumin control market is expected to grow significantly over the forecast period.
North America is expected to record the highest growth in the global microalbumin control market due to well-established healthcare infrastructure, high prevalence of diabetes and kidney disorders, and widespread adoption of advanced diagnostic technologies. Strong regulatory frameworks, routine health screenings, and increasing focus on preventive care drive the use of standardized microalbumin control materials.
The presence of key market players and continuous technological innovation, including automated analyzers and high-sensitivity assays, further fuels regional growth. For instance, in July 2022, Healthy.io’s Minuteful Kidney test, cleared by the FDA, introduced the first digital home kidney testing solution, enabling early detection of chronic kidney disease. This innovation increased awareness and demand for reliable microalbumin testing in North America, driving adoption of standardized microalbumin control materials in laboratories and point-of-care settings to support accurate, early-stage kidney disease diagnosis and monitoring.
Furthermore, the rising awareness among healthcare providers and patients regarding early kidney disease detection has strengthened the market, making North America the fastest-growing region for microalbumin control solutions. For instance, in November 2025, the Canada Kidney Foundation, reported that, the rising CKD mortality in Canada and the Kidney Foundation’s development of a national framework heightened awareness among healthcare providers and patients about early kidney disease detection. This increased focus on timely diagnosis and intervention boosted demand for standardized microalbumin control materials, positively impacting the global microalbumin control market.
Thus, all such factors are together are contributing this market’s growth in this region.
| Report Matrics | Details |
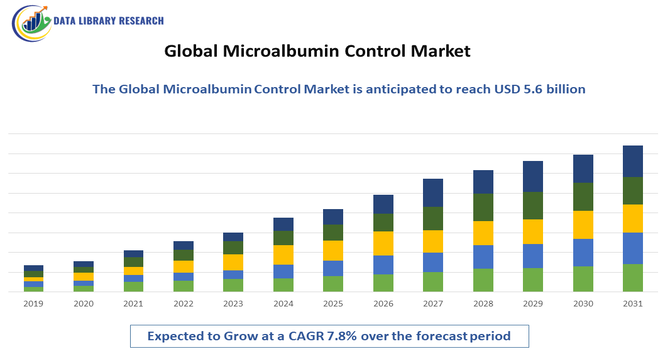
| Market Size Value | USD 5.6 billion |
| Growth Rate | CAGR of 7.8% |
| Forecast | 2026-2033 |
| Historical data | 2021-2024 |
| Base Year | 2025 |
| Report Coverage | Forecasted revenue, company rating, competitive environment, growth drivers, and trends |
| Segment Coverage | Type, Application, End-User, Geography |
| Regional Scope | North America, Europe, Asia Pacific, Middle East |
| Customized scope | Free customization of reports (With 3 months Analysis Support ) |
| To Learn More About This Report | Request a Free Sample Copy |
The competitive landscape of the Global Microalbumin Control Market is moderately fragmented, with key players focusing on product quality, reliability, and regulatory compliance. Leading companies invest in research and development to introduce high-precision, easy-to-use control materials compatible with automated analyzers. Strategic partnerships, mergers, and regional expansions are common to strengthen distribution and market presence. Competitive differentiation is achieved through product innovation, global certifications, and superior technical support. Emerging players target niche segments, such as point-of-care testing and specialty assays. Overall, competition encourages continuous improvement in accuracy, consistency, and technological advancement, benefiting laboratories and driving the overall growth of the market.
The major players for this market are:
Recent Development
Q1. What are the main growth-driving factors for this market?
The biggest driver is the rapidly rising global number of people suffering from chronic diseases like diabetes and hypertension. Since microalbuminuria is an early warning sign of kidney damage in these patients, the growing need for routine monitoring and early detection testing fuels the demand for high-quality control materials.
Q2. What are the main restraining factors for this market?
A key challenge is the high cost of advanced diagnostic equipment and the associated control solutions, which limits adoption in developing or resource-constrained countries. Another restraint is ensuring standardization and accuracy across different types of testing platforms and reagent kits, which affects reliability.
Q3. Which segment is expected to witness high growth?
The segment related to Point-of-Care (POC) Testing is expected to show high growth. This involves portable microalbumin control kits used outside central laboratories, such as in doctor's offices or for home testing. This trend makes monitoring quicker and more accessible for chronic disease management.
Q4. Who are the top major players for this market?
The market is led by major players in the in-vitro diagnostics (IVD) and laboratory control sectors. Key companies often include large names like Bio-Rad Laboratories, Quantimetrix, and Randox Laboratories, as they specialize in manufacturing quality control solutions for clinical laboratory testing.
Q5. Which country is the largest player?
North America, particularly the United States, holds the largest market share. This dominance is due to its advanced healthcare infrastructure, high prevalence of diabetes and obesity, and widespread adoption of stringent quality control practices in clinical laboratories and hospitals.
Data Library Research are conducted by industry experts who offer insight on industry structure, market segmentations technology assessment and competitive landscape (CL), and penetration, as well as on emerging trends. Their analysis is based on primary interviews (~ 80%) and secondary research (~ 20%) as well as years of professional expertise in their respective industries. Adding to this, by analysing historical trends and current market positions, our analysts predict where the market will be headed for the next five years. Furthermore, the varying trends of segment & categories geographically presented are also studied and the estimated based on the primary & secondary research.
In this particular report from the supply side Data Library Research has conducted primary surveys (interviews) with the key level executives (VP, CEO’s, Marketing Director, Business Development Manager and SOFT) of the companies that active & prominent as well as the midsized organization
FIGURE 1: DLR RESEARH PROCESS
Extensive primary research was conducted to gain a deeper insight of the market and industry performance. The analysis is based on both primary and secondary research as well as years of professional expertise in the respective industries.
In addition to analysing current and historical trends, our analysts predict where the market is headed over the next five years.
It varies by segment for these categories geographically presented in the list of market tables. Speaking about this particular report we have conducted primary surveys (interviews) with the key level executives (VP, CEO’s, Marketing Director, Business Development Manager and many more) of the major players active in the market.
Secondary ResearchSecondary research was mainly used to collect and identify information useful for the extensive, technical, market-oriented, and Friend’s study of the Global Extra Neutral Alcohol. It was also used to obtain key information about major players, market classification and segmentation according to the industry trends, geographical markets, and developments related to the market and technology perspectives. For this study, analysts have gathered information from various credible sources, such as annual reports, sec filings, journals, white papers, SOFT presentations, and company web sites.
Market Size EstimationBoth, top-down and bottom-up approaches were used to estimate and validate the size of the Global market and to estimate the size of various other dependent submarkets in the overall Extra Neutral Alcohol. The key players in the market were identified through secondary research and their market contributions in the respective geographies were determined through primary and secondary research.
Forecast Model