Neuroplasticity Market Overview and Analysis

The market was valued at approximately USD 11.17 billion in 2025 and is forecasted for exceptional growth, projected to reach over USD 61.53 billion by 2032. This phenomenal expansion corresponds to a very high Compound Annual Growth Rate (CAGR) of around 22.6% during the forecast period, 2025-2032.

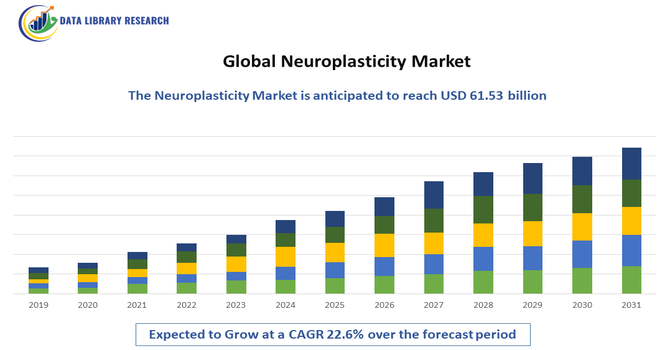
The Global Neuroplasticity Market is experiencing robust growth, driven by increasing research in neuroscience, rising prevalence of neurological disorders such as stroke, Alzheimer’s disease, and traumatic brain injuries, and growing adoption of neurorehabilitation therapies.

Advancements in brain imaging technologies, neurostimulation devices, and cognitive training platforms are enhancing understanding and application of neuroplasticity in clinical and therapeutic settings. Furthermore, the integration of artificial intelligence and virtual reality into neurorehabilitation programs is enabling personalized and effective treatments, fueling market expansion. Supportive government initiatives for mental health research and growing investment in neurotechnology startups are further propelling the market’s growth trajectory over the forecast period.

Neuroplasticity Market Latest Trends

The Global Neuroplasticity Market is experiencing several key trends reshaping its trajectory: the integration of artificial intelligence (AI) and machine learning algorithms into neurotechnology platforms is enabling personalized, adaptive interventions based on real-time brain data, significantly enhancing the efficacy of treatment. Virtual reality (VR), augmented reality (AR) and immersive digital therapeutics are increasingly used in neurorehabilitation settings to engage patients in gamified, task-oriented brain-training environments that stimulate neuroplastic change. Wearable brain-monitoring sensors and home-based neurotherapy devices are gaining traction, increasing accessibility of neuroplasticity interventions outside the clinic and supporting remote patient monitoring and tele-rehabilitation.

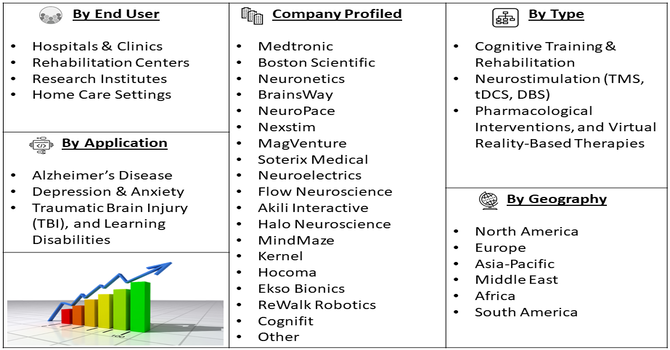
Segmentation: Global Neuroplasticity Market is segmented by Therapy Type (Cognitive Training & Rehabilitation, Neurostimulation (TMS, tDCS, DBS), Pharmacological Interventions, and Virtual Reality-Based Therapies), Application (Alzheimer’s Disease, Depression & Anxiety, Traumatic Brain Injury (TBI), and Learning Disabilities), End User (Hospitals & Clinics, Rehabilitation Centers, Research Institutes, and Home Care Settings), and Geography (North America, Europe, Asia-Pacific, Middle East and Africa, and South America). The report provides the value (in USD million) for the above segments.

Market Drivers:

  • Rising Prevalence of Neurological Disorders and Cognitive Impairments

One of the primary drivers of the Global Neuroplasticity Market is the increasing incidence of neurological conditions such as stroke, Alzheimer’s disease, Parkinson’s disease, traumatic brain injuries (TBI), and multiple sclerosis. For instance, the NCBI published an article that reported that, an estimated 2.8 million people worldwide lived with MS. The pooled incidence rate was 2.1 per 100,000 people annually, with diagnosis averaging at age 32. Women were twice as likely as men to have MS. These trends supported growth in the global neuroplasticity market by increasing demand for restorative therapies.

Neuroplasticity-based therapies—such as cognitive training, neurostimulation, and virtual rehabilitation—offer promising results by leveraging the brain’s ability to reorganize and form new neural connections. As healthcare systems and rehabilitation programs increasingly focus on long-term recovery and quality of life improvements, the demand for neuroplasticity-driven treatments continues to rise.

  • Technological Advancements in Neurorehabilitation and Brain Imaging

Rapid technological progress in brain imaging, artificial intelligence (AI), and neurostimulation devices is significantly driving the market forward. Innovations such as transcranial magnetic stimulation (TMS), transcranial direct current stimulation (tDCS), and deep brain stimulation (DBS) are enhancing the precision and effectiveness of neuroplasticity-based interventions. For instance, in 2020, Neuroglee Therapeutics announced its launch with USD 2.3 million in pre-seed funding to develop personalized, evidence-based digital therapeutics for neurodegenerative diseases. Its platform applied AI, machine learning, and digital biomarkers to slow conditions such as Alzheimer’s. This approach advanced the use of AI in neurotherapy and strengthened growth in the global neuroplasticity market by promoting data-driven, individualized brain-health solutions.

Market Restraints:

  • High Cost of Advanced Neurorehabilitation Technologies

One major challenge is the high cost of advanced neurorehabilitation technologies, such as neurostimulation devices, virtual reality platforms, and brain–computer interface systems, which makes them less accessible in developing and underfunded healthcare systems. Limited reimbursement policies and lack of standardized clinical protocols further hinder widespread adoption, as healthcare providers and patients often bear out-of-pocket expenses for neuroplasticity-based treatments.

Socio Economic Impact on Neuroplasticity Market

Neuroplasticity-based therapies and technologies are starting to change the way we think about healthcare. Instead of managing symptoms for life, many of these tools actually help people regain real function and independence. A good example is digital therapeutics for stroke and traumatic brain injury—patients often recover faster and rely less on long-term care, which also takes pressure off the healthcare system.

There’s an economic upside too. When people recover more quickly, they’re able to get back to work and daily life sooner, which boosts overall productivity. And as interest in cognitive enhancement grows, companies and schools are finding new ways to support performance and learning. Altogether, this shift is helping create a more adaptable, capable workforce that’s better prepared for the demands of today’s fast-moving economy.

Segmental Analysis:

  • Neurostimulation segment is expected to witness highest growth over the forecast period

The Neurostimulation segment, which includes technologies such as Transcranial Magnetic Stimulation (TMS), Transcranial Direct Current Stimulation (tDCS), and Deep Brain Stimulation (DBS), is expected to hold a dominant share during the forecast period. For instance, in 2024, Medtronic announced that the FDA approved its Percept RC Deep Brain Stimulation system, a rechargeable addition to the Percept family featuring BrainSense technology and SenSight leads. As the only sensing-enabled DBS platform, it enabled personalized treatment for movement disorders and epilepsy, conditions affecting millions of people in the United States.

This growth is attributed to the increasing adoption of non-invasive brain stimulation therapies in treating neurological and psychiatric disorders, supported by robust clinical evidence demonstrating improved cognitive and motor recovery outcomes.

  • Stroke Recovery segment is expected to witness highest growth over the forecast period

The Stroke Recovery segment leads the market, driven by the rising global incidence of stroke and the increasing need for effective post-stroke rehabilitation solutions. Neuroplasticity-based interventions—such as targeted brain stimulation and cognitive training—are proving instrumental in enhancing functional recovery by retraining neural circuits damaged during cerebrovascular events. The growing use of AI-enabled rehabilitation systems is further advancing stroke recovery outcomes.

  • Hospitals and Rehabilitation Centers segment is expected to witness highest growth over the forecast period

The Hospitals and Rehabilitation Centers segment dominates the market due to the availability of advanced neurorehabilitation technologies, specialized healthcare professionals, and comprehensive treatment facilities. However, the Home Care Settings segment is emerging rapidly with the rise of tele-neurorehabilitation and wearable neurotherapy devices that enable patients to continue treatment remotely with real-time monitoring.

  • North America region is expected to witness highest growth over the forecast period

The North America region is expected to witness the highest growth over the forecast period, driven by the strong presence of advanced healthcare infrastructure, high prevalence of neurological disorders, and increasing adoption of innovative neurorehabilitation technologies.

The region benefits from substantial investments in neuroscience research, favorable reimbursement frameworks, and early integration of digital and AI-driven neurotherapy solutions. For instance, Value-based reimbursement was promoted as a stronger alternative to fee-for-service, rewarding providers for improved patient outcomes rather than service volume. This approach incentivized better disease management and healthier lives. Its focus on quality care fostered favorable reimbursement frameworks that, in turn, supported growth in the U.S. neuroplasticity market by encouraging adoption of effective, outcome-driven therapies.

Additionally, the growing demand for non-invasive brain stimulation devices, coupled with supportive government initiatives promoting mental health and neurological care, further strengthens North America’s leadership in the Global Neuroplasticity Market. For instance, The U.S. government promoted mental health through SAMHSA, funded community programs, suicide-prevention services, and integrated care, while agencies like NIMH advanced research and policies addressing housing, education, and nutrition. These coordinated efforts strengthened supportive mental-health initiatives, which in turn created a favourable environment for the U.S. neuroplasticity market by encouraging innovation and adoption of effective brain-health interventions.

Thus, together such factors are driving the growth of above market in this region.

Neuroplasticity Market Competitive Landscape:

The competitive landscape of the Global Neuroplasticity market is diverse and rapidly evolving, featuring established medical-device manufacturers, specialized neurostimulation firms, digital-therapeutics developers, and rehabilitation-tech innovators competing on clinical evidence, device efficacy, software algorithms, reimbursement support, and strategic partnerships with health systems and research institutions.

Key Players:

  • Medtronic
  • Boston Scientific
  • Neuronetics
  • BrainsWay
  • NeuroPace
  • Nexstim
  • MagVenture
  • Soterix Medical
  • Neuroelectrics
  • Flow Neuroscience
  • Akili Interactive
  • Halo Neuroscience
  • MindMaze
  • Kernel
  • Hocoma
  • Ekso Bionics
  • ReWalk Robotics
  • Cognifit
  • Posit Science
  • Motus Nova

Recent Development

  • In October 2025, Delix Therapeutics, a clinical-stage neuroscience company developing a new type of treatment called neuroplastogens, announced encouraging results from its Phase Ib trial of zalsupindole (DLX-001) in adults with major depressive disorder. The company also shared that the FDA has approved its Investigational New Drug application for a Phase II study that will allow at-home self-administration, reinforcing both the drug’s safety and the promise of Delix’s platform.


  • In July 2025, an article published by Brain Research, reported that, neuroplasticity, the brain’s ability to reorganize itself, was once thought to occur only in childhood but was later shown to persist throughout life, supporting learning, memory, and recovery. Researchers made significant progress in clarifying its mechanisms and therapeutic potential. This article reviewed synaptic and structural changes, neurogenesis, and functional reorganization, along with adaptive and maladaptive effects, emerging interventions, conflicting findings, methodological challenges, and ethical concerns to offer a balanced perspective for practitioners and policymakers.


Frequently Asked Questions (FAQ) :

Q1. What are the main growth-driving factors for this market?

The primary driver is the increasing public and scientific awareness of the brain's capacity for change, leading to greater acceptance of neuro-rehabilitation. Growth is also fueled by the rising incidence of neurological disorders (like stroke, TBI, and ADHD) and age-related cognitive decline, requiring non-pharmacological interventions. Furthermore, rapid advancements in brain-computer interfaces (BCI) and neurofeedback software are translating complex science into marketable therapeutic tools.

Q2. What are the main restraining factors for this market?

A key constraint is the lack of standardized clinical validation and regulatory approval for many emerging neuroplasticity-based software and digital therapies. High-quality long-term efficacy data is often scarce, leading to skepticism among healthcare providers. Additionally, the high cost of sophisticated personalized neuro-technologies (like specialized BCI systems) limits accessibility, particularly outside of well-funded research and elite clinical settings.

Q3. Which segment is expected to witness high growth?

The Cognitive Enhancement and Training Segment is projected to witness the highest growth. This includes software, games, and digital platforms designed to improve memory, attention, and executive function in healthy individuals and those with mild impairment. Fueled by direct-to-consumer demand for "brain training" apps and employee wellness programs aiming to boost productivity, this accessible and scalable software segment bypasses clinical hurdles, driving quick market adoption.

Q4. Who are the top major players for this market?

The market is fragmented, comprising specialized medical device companies, software developers, and academic spin-offs. Top major players include Medtronic (for deep brain stimulation devices), Posit Science, Lumosity, and Cognito Therapeutics. Competition focuses on securing FDA or equivalent regulatory clearances for medical applications and leveraging partnerships with academic research institutions to develop evidence-based digital therapeutics that can rival traditional pharmacological treatments.

Q5. Which country is the largest player?

The United States is the largest country player, due to its global lead in neuroscience research funding, substantial venture capital investment in biomedical startups, and a cultural willingness to embrace high-tech, personalized health solutions. The presence of major pharmaceutical and medical device manufacturers, combined with favorable regulatory pathways (like FDA Breakthrough Device designation) for novel neurological therapies, cements the U.S. as the dominant market force.

Neuroplasticity MARKET STUDY GLOBAL MARKET ANALYSIS, INSIGHTS AND FORECAST, 2022-2029

    1. Introduction

    • 1.1. Research Scope
    • 1.2. Market Segmentation
    • 1.3. Research Methodology
    • 1.4. Definitions and Assumptions

    2. Executive Summary

      3. Market Dynamics

      • 3.1. Market Drivers
      • 3.2. Market Restraints
      • 3.3. Market Opportunities

      4. Key Insights

      • 4.1. Key Emerging Trends – For Major Countries
      • 4.2. Latest Technological Advancement
      • 4.3. Regulatory Landscape
      • 4.4. Industry SWOT Analysis
      • 4.5. Porters Five Forces Analysis

      5. Global Neuroplasticity Market Analysis (USD Billion), Insights and Forecast, 2018-2029

      • 5.1. Key Findings / Summary
      • 5.2. Market Analysis, Insights and Forecast – By Segment 1
        • 5.2.1. Sub-Segment 1
        • 5.2.2. Sub-Segment 2
      • 5.3. Market Analysis, Insights and Forecast – By Segment 2
        • 5.3.1. Sub-Segment 1
        • 5.3.2. Sub-Segment 2
        • 5.3.3. Sub-Segment 3
        • 5.3.4. Others
      • 5.4. Market Analysis, Insights and Forecast – By Segment 3
        • 5.4.1. Sub-Segment 1
        • 5.4.2. Sub-Segment 2
        • 5.4.3. Sub-Segment 3
        • 5.4.4. Others
      • 5.5. Market Analysis, Insights and Forecast – By Region
        • 5.5.1. North America
        • 5.5.2. Latin America
        • 5.5.3. Europe
        • 5.5.4. Asia Pacific
        • 5.5.5. Middle East and Africa

      6. North America Neuroplasticity Market Analysis (USD Billion), Insights and Forecast, 2018-2029

      • 6.1. Key Findings / Summary
      • 6.2. Market Analysis, Insights and Forecast – By Segment 1
        • 6.2.1. Sub-Segment 1
        • 6.2.2. Sub-Segment 2
      • 6.3. Market Analysis, Insights and Forecast – By Segment 2
        • 6.3.1. Sub-Segment 1
        • 6.3.2. Sub-Segment 2
        • 6.3.3. Sub-Segment 3
        • 6.3.4. Others
      • 6.4. Market Analysis, Insights and Forecast – By Segment 3
        • 6.4.1. Sub-Segment 1
        • 6.4.2. Sub-Segment 2
        • 6.4.3. Sub-Segment 3
        • 6.4.4. Others
      • 6.5. Market Analysis, Insights and Forecast – By Country
        • 6.5.1. U.S.
        • 6.5.2. Canada

      7. Latin America Neuroplasticity Market Analysis (USD Billion), Insights and Forecast, 2018-2029

      • 7.1. Key Findings / Summary
      • 7.2. Market Analysis, Insights and Forecast – By Segment 1
        • 7.2.1. Sub-Segment 1
        • 7.2.2. Sub-Segment 2
      • 7.3. Market Analysis, Insights and Forecast – By Segment 2
        • 7.3.1. Sub-Segment 1
        • 7.3.2. Sub-Segment 2
        • 7.3.3. Sub-Segment 3
        • 7.3.4. Others
      • 7.4. Market Analysis, Insights and Forecast – By Segment 3
        • 7.4.1. Sub-Segment 1
        • 7.4.2. Sub-Segment 2
        • 7.4.3. Sub-Segment 3
        • 7.4.4. Others
      • 7.5. Insights and Forecast – By Country
        • 7.5.1. Brazil
        • 7.5.2. Mexico
        • 7.5.3. Rest of Latin America

      8. Europe Neuroplasticity Market Analysis (USD Billion), Insights and Forecast, 2018-2029

      • 8.1. Key Findings / Summary
      • 8.2. Market Analysis, Insights and Forecast – By Segment 1
        • 8.2.1. Sub-Segment 1
        • 8.2.2. Sub-Segment 2
      • 8.3. Market Analysis, Insights and Forecast – By Segment 2
        • 8.3.1. Sub-Segment 1
        • 8.3.2. Sub-Segment 2
        • 8.3.3. Sub-Segment 3
        • 8.3.4. Others
      • 8.4. Market Analysis, Insights and Forecast – By Segment 3
        • 8.4.1. Sub-Segment 1
        • 8.4.2. Sub-Segment 2
        • 8.4.3. Sub-Segment 3
        • 8.4.4. Others
      • 8.5. Market Analysis, Insights and Forecast – By Country
        • 8.5.1. UK
        • 8.5.2. Germany
        • 8.5.3. France
        • 8.5.4. Italy
        • 8.5.5. Spain
        • 8.5.6. Russia
        • 8.5.7. Rest of Europe

      9. Asia Pacific Neuroplasticity Market Analysis (USD Billion), Insights and Forecast, 2018-2029

      • 9.1. Key Findings / Summary
      • 9.2. Market Analysis, Insights and Forecast – By Segment 1
        • 9.2.1. Sub-Segment 1
        • 9.2.2. Sub-Segment 2
      • 9.3. Market Analysis, Insights and Forecast – By Segment 2
        • 9.3.1. Sub-Segment 1
        • 9.3.2. Sub-Segment 2
        • 9.3.3. Sub-Segment 3
        • 9.3.4. Others
      • 9.4. Market Analysis, Insights and Forecast – By Segment 3
        • 9.4.1. Sub-Segment 1
        • 9.4.2. Sub-Segment 2
        • 9.4.3. Sub-Segment 3
        • 9.4.4. Others
      • 9.5. Market Analysis, Insights and Forecast – By Country
        • 9.5.1. China
        • 9.5.2. India
        • 9.5.3. Japan
        • 9.5.4. Australia
        • 9.5.5. South East Asia
        • 9.5.6. Rest of Asia Pacific

      10. Middle East & Africa Neuroplasticity Market Analysis (USD Billion), Insights and Forecast, 2018-2029

      • 10.1. Key Findings / Summary
      • 10.2. Market Analysis, Insights and Forecast – By Segment 1
        • 10.2.1. Sub-Segment 1
        • 10.2.2. Sub-Segment 2
      • 10.3. Market Analysis, Insights and Forecast – By Segment 2
        • 10.3.1. Sub-Segment 1
        • 10.3.2. Sub-Segment 2
        • 10.3.3. Sub-Segment 3
        • 10.3.4. Others
      • 10.4. Market Analysis, Insights and Forecast – By Segment 3
        • 10.4.1. Sub-Segment 1
        • 10.4.2. Sub-Segment 2
        • 10.4.3. Sub-Segment 3
        • 10.4.4. Others
      • 10.5. Market Analysis, Insights and Forecast – By Country
        • 10.5.1. GCC
        • 10.5.2. South Africa
        • 10.5.3. Rest of Middle East & Africa

      11. Competitive Analysis

      • 11.1. Company Market Share Analysis, 2018
      • 11.2. Key Industry Developments
      • 11.3. Company Profile
        • 11.3.1. Company 1
          • 11.3.1.1. Business Overview
          • 11.3.1.2. Segment 1 & Service Offering
          • 11.3.1.3. Overall Revenue
          • 11.3.1.4. Geographic Presence
          • 11.3.1.5. Recent Development
        *Similar details will be provided for the following companies
        • 11.3.2. Company 2
        • 11.3.3. Company 3
        • 11.3.4. Company 4
        • 11.3.5. Company 5
        • 11.3.6. Company 6
        • 11.3.7. Company 7
        • 11.3.8. Company 8
        • 11.3.9. Company 9
        • 11.3.10. Company 10
        • 11.3.11. Company 11
        • 11.3.12. Company 12
      List of Figures

      Figure 1: Global Neuroplasticity Market Revenue Breakdown (USD Billion, %) by Region, 2022 & 2029
      Figure 2: Global Neuroplasticity Market Value Share (%), By Segment 1, 2022 & 2029
      Figure 3: Global Neuroplasticity Market Forecast (USD Billion), by Sub-Segment 1, 2018-2029
      Figure 4: Global Neuroplasticity Market Forecast (USD Billion), by Sub-Segment 2, 2018-2029
      Figure 5: Global Neuroplasticity Market Value Share (%), By Segment 2, 2022 & 2029
      Figure 6: Global Neuroplasticity Market Forecast (USD Billion), by Sub-Segment 1, 2018-2029
      Figure 7: Global Neuroplasticity Market Forecast (USD Billion), by Sub-Segment 2, 2018-2029
      Figure 8: Global Neuroplasticity Market Forecast (USD Billion), by Sub-Segment 3, 2018-2029
      Figure 9: Global Neuroplasticity Market Forecast (USD Billion), by Others, 2018-2029
      Figure 10: Global Neuroplasticity Market Value Share (%), By Segment 3, 2022 & 2029
      Figure 11: Global Neuroplasticity Market Forecast (USD Billion), by Sub-Segment 1, 2018-2029
      Figure 12: Global Neuroplasticity Market Forecast (USD Billion), by Sub-Segment 2, 2018-2029
      Figure 13: Global Neuroplasticity Market Forecast (USD Billion), by Sub-Segment 3, 2018-2029
      Figure 14: Global Neuroplasticity Market Forecast (USD Billion), by Others, 2018-2029
      Figure 15: Global Neuroplasticity Market Value (USD Billion), by Region, 2022 & 2029
      Figure 16: North America Neuroplasticity Market Value Share (%), By Segment 1, 2022 & 2029
      Figure 17: North America Neuroplasticity Market Forecast (USD Billion), by Sub-Segment 1, 2018-2029
      Figure 18: North America Neuroplasticity Market Forecast (USD Billion), by Sub-Segment 2, 2018-2029
      Figure 19: North America Neuroplasticity Market Value Share (%), By Segment 2, 2022 & 2029
      Figure 20: North America Neuroplasticity Market Forecast (USD Billion), by Sub-Segment 1, 2018-2029
      Figure 21: North America Neuroplasticity Market Forecast (USD Billion), by Sub-Segment 2, 2018-2029
      Figure 22: North America Neuroplasticity Market Forecast (USD Billion), by Sub-Segment 3, 2018-2029
      Figure 23: North America Neuroplasticity Market Forecast (USD Billion), by Others, 2018-2029
      Figure 24: North America Neuroplasticity Market Value Share (%), By Segment 3, 2022 & 2029
      Figure 25: North America Neuroplasticity Market Forecast (USD Billion), by Sub-Segment 1, 2018-2029
      Figure 26: North America Neuroplasticity Market Forecast (USD Billion), by Sub-Segment 2, 2018-2029
      Figure 27: North America Neuroplasticity Market Forecast (USD Billion), by Sub-Segment 3, 2018-2029
      Figure 28: North America Neuroplasticity Market Forecast (USD Billion), by Others, 2018-2029
      Figure 29: North America Neuroplasticity Market Forecast (USD Billion), by U.S., 2018-2029
      Figure 30: North America Neuroplasticity Market Forecast (USD Billion), by Canada, 2018-2029
      Figure 31: Latin America Neuroplasticity Market Value Share (%), By Segment 1, 2022 & 2029
      Figure 32: Latin America Neuroplasticity Market Forecast (USD Billion), by Sub-Segment 1, 2018-2029
      Figure 33: Latin America Neuroplasticity Market Forecast (USD Billion), by Sub-Segment 2, 2018-2029
      Figure 34: Latin America Neuroplasticity Market Value Share (%), By Segment 2, 2022 & 2029
      Figure 35: Latin America Neuroplasticity Market Forecast (USD Billion), by Sub-Segment 1, 2018-2029
      Figure 36: Latin America Neuroplasticity Market Forecast (USD Billion), by Sub-Segment 2, 2018-2029
      Figure 37: Latin America Neuroplasticity Market Forecast (USD Billion), by Sub-Segment 3, 2018-2029
      Figure 38: Latin America Neuroplasticity Market Forecast (USD Billion), by Others, 2018-2029
      Figure 39: Latin America Neuroplasticity Market Value Share (%), By Segment 3, 2022 & 2029
      Figure 40: Latin America Neuroplasticity Market Forecast (USD Billion), by Sub-Segment 1, 2018-2029
      Figure 41: Latin America Neuroplasticity Market Forecast (USD Billion), by Sub-Segment 2, 2018-2029
      Figure 42: Latin America Neuroplasticity Market Forecast (USD Billion), by Sub-Segment 3, 2018-2029
      Figure 43: Latin America Neuroplasticity Market Forecast (USD Billion), by Others, 2018-2029
      Figure 44: Latin America Neuroplasticity Market Forecast (USD Billion), by Brazil, 2018-2029
      Figure 45: Latin America Neuroplasticity Market Forecast (USD Billion), by Mexico, 2018-2029
      Figure 46: Latin America Neuroplasticity Market Forecast (USD Billion), by Rest of Latin America, 2018-2029
      Figure 47: Europe Neuroplasticity Market Value Share (%), By Segment 1, 2022 & 2029
      Figure 48: Europe Neuroplasticity Market Forecast (USD Billion), by Sub-Segment 1, 2018-2029
      Figure 49: Europe Neuroplasticity Market Forecast (USD Billion), by Sub-Segment 2, 2018-2029
      Figure 50: Europe Neuroplasticity Market Value Share (%), By Segment 2, 2022 & 2029
      Figure 51: Europe Neuroplasticity Market Forecast (USD Billion), by Sub-Segment 1, 2018-2029
      Figure 52: Europe Neuroplasticity Market Forecast (USD Billion), by Sub-Segment 2, 2018-2029
      Figure 53: Europe Neuroplasticity Market Forecast (USD Billion), by Sub-Segment 3, 2018-2029
      Figure 54: Europe Neuroplasticity Market Forecast (USD Billion), by Others, 2018-2029
      Figure 55: Europe Neuroplasticity Market Value Share (%), By Segment 3, 2022 & 2029
      Figure 56: Europe Neuroplasticity Market Forecast (USD Billion), by Sub-Segment 1, 2018-2029
      Figure 57: Europe Neuroplasticity Market Forecast (USD Billion), by Sub-Segment 2, 2018-2029
      Figure 58: Europe Neuroplasticity Market Forecast (USD Billion), by Sub-Segment 3, 2018-2029
      Figure 59: Europe Neuroplasticity Market Forecast (USD Billion), by Others, 2018-2029
      Figure 60: Europe Neuroplasticity Market Forecast (USD Billion), by U.K., 2018-2029
      Figure 61: Europe Neuroplasticity Market Forecast (USD Billion), by Germany, 2018-2029
      Figure 62: Europe Neuroplasticity Market Forecast (USD Billion), by France, 2018-2029
      Figure 63: Europe Neuroplasticity Market Forecast (USD Billion), by Italy, 2018-2029
      Figure 64: Europe Neuroplasticity Market Forecast (USD Billion), by Spain, 2018-2029
      Figure 65: Europe Neuroplasticity Market Forecast (USD Billion), by Russia, 2018-2029
      Figure 66: Europe Neuroplasticity Market Forecast (USD Billion), by Rest of Europe, 2018-2029
      Figure 67: Asia Pacific Neuroplasticity Market Value Share (%), By Segment 1, 2022 & 2029
      Figure 68: Asia Pacific Neuroplasticity Market Forecast (USD Billion), by Sub-Segment 1, 2018-2029
      Figure 69: Asia Pacific Neuroplasticity Market Forecast (USD Billion), by Sub-Segment 2, 2018-2029
      Figure 70: Asia Pacific Neuroplasticity Market Value Share (%), By Segment 2, 2022 & 2029
      Figure 71: Asia Pacific Neuroplasticity Market Forecast (USD Billion), by Sub-Segment 1, 2018-2029
      Figure 72: Asia Pacific Neuroplasticity Market Forecast (USD Billion), by Sub-Segment 2, 2018-2029
      Figure 73: Asia Pacific Neuroplasticity Market Forecast (USD Billion), by Sub-Segment 3, 2018-2029
      Figure 74: Asia Pacific Neuroplasticity Market Forecast (USD Billion), by Others, 2018-2029
      Figure 75: Asia Pacific Neuroplasticity Market Value Share (%), By Segment 3, 2022 & 2029
      Figure 76: Asia Pacific Neuroplasticity Market Forecast (USD Billion), by Sub-Segment 1, 2018-2029
      Figure 77: Asia Pacific Neuroplasticity Market Forecast (USD Billion), by Sub-Segment 2, 2018-2029
      Figure 78: Asia Pacific Neuroplasticity Market Forecast (USD Billion), by Sub-Segment 3, 2018-2029
      Figure 79: Asia Pacific Neuroplasticity Market Forecast (USD Billion), by Others, 2018-2029
      Figure 80: Asia Pacific Neuroplasticity Market Forecast (USD Billion), by China, 2018-2029
      Figure 81: Asia Pacific Neuroplasticity Market Forecast (USD Billion), by India, 2018-2029
      Figure 82: Asia Pacific Neuroplasticity Market Forecast (USD Billion), by Japan, 2018-2029
      Figure 83: Asia Pacific Neuroplasticity Market Forecast (USD Billion), by Australia, 2018-2029
      Figure 84: Asia Pacific Neuroplasticity Market Forecast (USD Billion), by Southeast Asia, 2018-2029
      Figure 85: Asia Pacific Neuroplasticity Market Forecast (USD Billion), by Rest of Asia Pacific, 2018-2029
      Figure 86: Middle East & Africa Neuroplasticity Market Value Share (%), By Segment 1, 2022 & 2029
      Figure 87: Middle East & Africa Neuroplasticity Market Forecast (USD Billion), by Sub-Segment 1, 2018-2029
      Figure 88: Middle East & Africa Neuroplasticity Market Forecast (USD Billion), by Sub-Segment 2, 2018-2029
      Figure 89: Middle East & Africa Neuroplasticity Market Value Share (%), By Segment 2, 2022 & 2029
      Figure 90: Middle East & Africa Neuroplasticity Market Forecast (USD Billion), by Sub-Segment 1, 2018-2029
      Figure 91: Middle East & Africa Neuroplasticity Market Forecast (USD Billion), by Sub-Segment 2, 2018-2029
      Figure 92: Middle East & Africa Neuroplasticity Market Forecast (USD Billion), by Sub-Segment 3, 2018-2029
      Figure 93: Middle East & Africa Neuroplasticity Market Forecast (USD Billion), by Others, 2018-2029
      Figure 94: Middle East & Africa Neuroplasticity Market Value Share (%), By Segment 3, 2022 & 2029
      Figure 95: Middle East & Africa Neuroplasticity Market Forecast (USD Billion), by Sub-Segment 1, 2018-2029
      Figure 96: Middle East & Africa Neuroplasticity Market Forecast (USD Billion), by Sub-Segment 2, 2018-2029
      Figure 97: Middle East & Africa Neuroplasticity Market Forecast (USD Billion), by Sub-Segment 3, 2018-2029
      Figure 98: Middle East & Africa Neuroplasticity Market Forecast (USD Billion), by Others, 2018-2029
      Figure 99: Middle East & Africa Neuroplasticity Market Forecast (USD Billion), by GCC, 2018-2029
      Figure 100: Middle East & Africa Neuroplasticity Market Forecast (USD Billion), by South Africa, 2018-2029
      Figure 101: Middle East & Africa Neuroplasticity Market Forecast (USD Billion), by Rest of Middle East & Africa, 2018-2029 
      List of Tables
      Table 1: Global Neuroplasticity Market Revenue (USD Billion) Forecast, by Segment 1, 2018-2029
      Table 2: Global Neuroplasticity Market Revenue (USD Billion) Forecast, by Segment 2, 2018-2029
      Table 3: Global Neuroplasticity Market Revenue (USD Billion) Forecast, by Segment 3, 2018-2029
      Table 4: Global Neuroplasticity Market Revenue (USD Billion) Forecast, by Region, 2018-2029
      Table 5: North America Neuroplasticity Market Revenue (USD Billion) Forecast, by Segment 1, 2018-2029
      Table 6: North America Neuroplasticity Market Revenue (USD Billion) Forecast, by Segment 2, 2018-2029
      Table 7: North America Neuroplasticity Market Revenue (USD Billion) Forecast, by Segment 3, 2018-2029
      Table 8: North America Neuroplasticity Market Revenue (USD Billion) Forecast, by Country, 2018-2029
      Table 9: Europe Neuroplasticity Market Revenue (USD Billion) Forecast, by Segment 1, 2018-2029
      Table 10: Europe Neuroplasticity Market Revenue (USD Billion) Forecast, by Segment 2, 2018-2029
      Table 11: Europe Neuroplasticity Market Revenue (USD Billion) Forecast, by Segment 3, 2018-2029
      Table 12: Europe Neuroplasticity Market Revenue (USD Billion) Forecast, by Country, 2018-2029
      Table 13: Latin America Neuroplasticity Market Revenue (USD Billion) Forecast, by Segment 1, 2018-2029
      Table 14: Latin America Neuroplasticity Market Revenue (USD Billion) Forecast, by Segment 2, 2018-2029
      Table 15: Latin America Neuroplasticity Market Revenue (USD Billion) Forecast, by Segment 3, 2018-2029
      Table 16: Latin America Neuroplasticity Market Revenue (USD Billion) Forecast, by Country, 2018-2029
      Table 17: Asia Pacific Neuroplasticity Market Revenue (USD Billion) Forecast, by Segment 1, 2018-2029
      Table 18: Asia Pacific Neuroplasticity Market Revenue (USD Billion) Forecast, by Segment 2, 2018-2029
      Table 19: Asia Pacific Neuroplasticity Market Revenue (USD Billion) Forecast, by Segment 3, 2018-2029
      Table 20: Asia Pacific Neuroplasticity Market Revenue (USD Billion) Forecast, by Country, 2018-2029
      Table 21: Middle East & Africa Neuroplasticity Market Revenue (USD Billion) Forecast, by Segment 1, 2018-2029
      Table 22: Middle East & Africa Neuroplasticity Market Revenue (USD Billion) Forecast, by Segment 2, 2018-2029
      Table 23: Middle East & Africa Neuroplasticity Market Revenue (USD Billion) Forecast, by Segment 3, 2018-2029
      Table 24: Middle East & Africa Neuroplasticity Market Revenue (USD Billion) Forecast, by Country, 2018-2029
      Research Process

      Data Library Research are conducted by industry experts who offer insight on industry structure, market segmentations technology assessment and competitive landscape (CL), and penetration, as well as on emerging trends. Their analysis is based on primary interviews (~ 80%) and secondary research (~ 20%) as well as years of professional expertise in their respective industries. Adding to this, by analysing historical trends and current market positions, our analysts predict where the market will be headed for the next five years. Furthermore, the varying trends of segment & categories geographically presented are also studied and the estimated based on the primary & secondary research.

      In this particular report from the supply side Data Library Research has conducted primary surveys (interviews) with the key level executives (VP, CEO’s, Marketing Director, Business Development Manager and SOFT) of the companies that active & prominent as well as the midsized organization

      FIGURE 1: DLR RESEARH PROCESS

      research-methodology1

      Primary Research

      Extensive primary research was conducted to gain a deeper insight of the market and industry performance. The analysis is based on both primary and secondary research as well as years of professional expertise in the respective industries.

      In addition to analysing current and historical trends, our analysts predict where the market is headed over the next five years.

      It varies by segment for these categories geographically presented in the list of market tables. Speaking about this particular report we have conducted primary surveys (interviews) with the key level executives (VP, CEO’s, Marketing Director, Business Development Manager and many more) of the major players active in the market.

      Secondary Research

      Secondary research was mainly used to collect and identify information useful for the extensive, technical, market-oriented, and Friend’s study of the Global Extra Neutral Alcohol. It was also used to obtain key information about major players, market classification and segmentation according to the industry trends, geographical markets, and developments related to the market and technology perspectives. For this study, analysts have gathered information from various credible sources, such as annual reports, sec filings, journals, white papers, SOFT presentations, and company web sites.

      Market Size Estimation

      Both, top-down and bottom-up approaches were used to estimate and validate the size of the Global market and to estimate the size of various other dependent submarkets in the overall Extra Neutral Alcohol. The key players in the market were identified through secondary research and their market contributions in the respective geographies were determined through primary and secondary research.

      Forecast Model

      research-methodology2