Offline Gyms Market Overview and Analysis

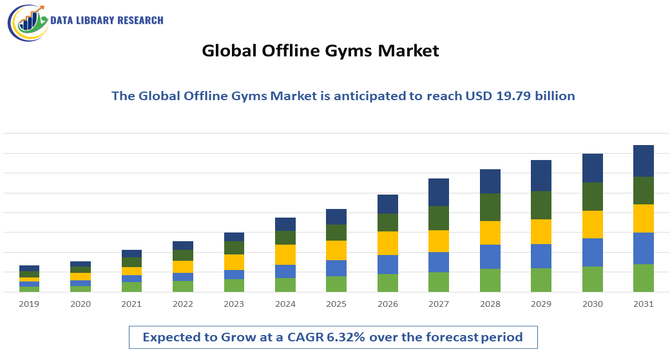
The global home fitness equipment market size is projected to grow from $12.88 billion in 2025 to $19.79 billion by 2032, exhibiting a CAGR of 6.32%.

The global offline gyms market includes physical fitness centers where people work out in person using equipment, group classes, and personal training services. These gyms range from large health clubs to smaller neighborhood fitness centers and specialized studios. Despite the growth of digital fitness, offline gyms remain important because they offer hands-on guidance, social interaction, and structured environments that many people prefer. They serve individuals with different fitness goals, from general wellness to strength training and rehabilitation. The market continues to evolve as gyms focus on creating engaging, supportive spaces that motivate people to maintain consistent and healthy exercise routines.

Offline Gyms Market Latest Trends

The current trends in the offline gyms market focus on experience, personalization, and community. Many gyms are moving beyond basic equipment to offer group classes, wellness programs, and lifestyle coaching. There is growing interest in functional training, strength-based workouts, and mind–body activities such as yoga and stretching. Gyms are also adopting technology for scheduling, progress tracking, and member engagement while keeping in-person training central. Flexible memberships and hybrid options are becoming common to meet changing consumer expectations.

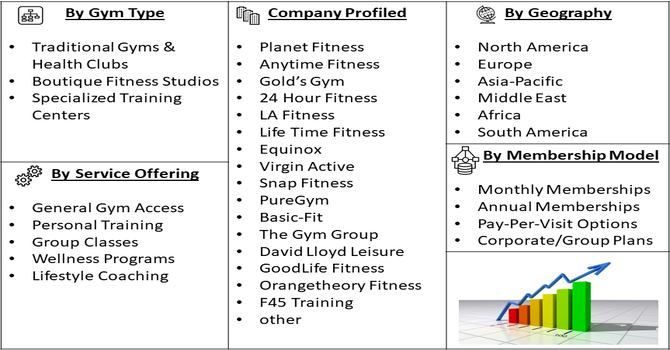
Segmentation: The Global Offline Gyms Market is Segmented by Gym Type (Traditional Gyms & Health Clubs, Boutique Fitness Studios, and Specialized Training Centers), Membership Model (Monthly Memberships, Annual Memberships, Pay-Per-Visit Options, and Corporate/Group Plans), Service Offering (General Gym Access, Personal Training, Group Classes, Wellness Programs, and Lifestyle Coaching), and Geography (North America, Europe, Asia-Pacific, Middle East and Africa, and South America). The report provides the value (in USD million) for the above segments.

Market Drivers:

  • Rising Health and Fitness Awareness

Growing awareness of physical health, mental wellbeing, and preventive care is a major driver of the global offline gyms market. People across age groups are increasingly prioritizing active lifestyles to manage stress, improve immunity, and prevent lifestyle-related conditions.

Offline gyms provide structured environments, professional guidance, and social motivation that encourage consistency in fitness routines. Campaigns promoting wellness, social media influence, and workplace health initiatives further support this shift.

As fitness becomes part of everyday life rather than a short-term goal, demand for accessible and well-equipped physical gyms continues to rise worldwide. For instance, the data published in August 2025, by MMCG Invest, reported U.S. gym density averages about 13 gyms per 100,000 people, and the memberships rebounded to 72.9 million in 2023, a 13% increase since 2019.

  • Demand for In-Person Training and Community Experience

Many consumers prefer offline gyms for the personal interaction, hands-on coaching, and sense of community they provide. In-person training allows better form correction, personalized workout plans, and real-time motivation that digital platforms cannot fully replicate. Group classes and community-based workouts foster accountability and social connection, enhancing long-term engagement. This demand is especially strong among beginners and individuals seeking structured fitness guidance. As people increasingly value social experiences alongside physical activity, offline gyms remain attractive as shared spaces that support both fitness goals and social wellbeing.

Market Restraints:

  • Competition from Home Fitness and Digital Platforms

The growth of home fitness equipment and online workout platforms poses a significant restraint on the offline gyms market. Consumers seeking convenience and flexibility often opt for at-home workouts that require less time commitment and eliminate travel. Digital fitness apps and virtual training programs also offer personalized guidance at lower perceived effort. This shift challenges gyms to maintain membership retention and justify in-person value. As a result, offline gym operators must invest more in experience, service quality, and differentiation to compete with increasingly accessible home-based fitness alternatives.

Socioeconomic Impact on Offline Gyms Market

Offline gyms play an important role in improving public health by encouraging active lifestyles and reducing the risk of chronic diseases. They contribute to local economies by creating jobs for trainers, instructors, administrative staff, and maintenance workers. Gyms also support related industries such as fitness equipment, apparel, and nutrition services. On a social level, they provide spaces for interaction, motivation, and community building, which can positively affect mental health. As awareness of fitness grows, gyms help individuals build long-term healthy habits, supporting productivity and overall wellbeing across different segments of society.

Segmental Analysis:

  • Boutique Fitness Studios segment is expected to witness highest growth over the forecast period

Boutique fitness studios are expected to witness the highest growth over the forecast period due to their personalized, experience-driven approach. These studios focus on specialized workout formats such as yoga, cycling, functional training, and high-intensity programs, appealing to consumers seeking targeted results and professional attention. Their smaller class sizes foster stronger trainer–member relationships and a sense of community, which improves engagement and loyalty. Boutique studios also emphasize atmosphere, branding, and lifestyle alignment, making fitness feel more social and aspirational. As consumers increasingly value quality, specialization, and immersive experiences, boutique fitness studios continue to gain popularity across urban and suburban markets.

  • Annual Memberships segment is expected to witness highest growth over the forecast period

The annual memberships segment is expected to witness the highest growth over the forecast period as consumers seek cost-effective and commitment-based fitness solutions. Annual plans offer convenience, stability, and perceived value, encouraging members to maintain consistent workout routines. For gym operators, these memberships provide predictable revenue and improved customer retention. Many gyms enhance annual packages with added benefits such as personal training sessions, wellness programs, and priority access to classes, making them more attractive. As fitness becomes a long-term lifestyle choice rather than a temporary goal, more consumers are opting for annual memberships to support sustained health and wellness habits.

  • Group Classes segment is expected to witness highest growth over the forecast period

The group classes segment is expected to witness the highest growth over the forecast period due to rising demand for social and motivational workout environments. Group classes create a sense of accountability, energy, and community that encourages regular participation. Activities such as strength training, dance-based workouts, yoga, and functional fitness appeal to diverse fitness levels and preferences. Led by professional instructors, these sessions provide structure and variety, reducing workout monotony. As individuals increasingly seek interactive and engaging fitness experiences, group classes remain a key differentiator for gyms aiming to attract and retain members.

  • North American Region is expected to witness highest growth over the forecast period

The North American region is expected to witness the highest growth over the forecast period due to strong fitness awareness, established gym culture, and high demand for structured wellness solutions. Consumers in the region actively invest in physical health, mental wellbeing, and preventive care, supporting consistent gym participation.

The presence of major gym chains, boutique studios, and innovative fitness concepts further strengthens market expansion. For instance, in April 2025, the strategic investment by Leonard Green & Partners in Crunch Fitness strengthened North America’s offline gyms market by accelerating expansion, enhancing operational capabilities, and increasing competitive intensity. The transaction supported greater capital infusion for club growth, brand development, and innovation, reinforcing investor confidence and contributing to consolidation and long-term stability within the region’s physical fitness industry.

Similarly, in December 2025, Planet Fitness’s share repurchase action positively impacted North America’s offline gyms market by signaling strong financial stability and management confidence. The move reinforced investor trust in the brick-and-mortar fitness model, supported long-term growth expectations, and strengthened Planet Fitness’s market position, indirectly encouraging capital flow and competitive confidence across the regional offline fitness indust.

Additionally, employers and communities increasingly promote fitness as part of daily life. With a focus on experience, personalization, and community-driven workouts, North America continues to lead growth in the offline gyms market.

Offline Gyms Market Competitive Landscape

The competitive landscape of the offline gyms market is diverse and dynamic. Large international gym chains compete with regional brands, boutique studios, and independent fitness centers. Budget gyms attract cost-conscious members, while premium clubs focus on high-quality facilities and personalized services. Boutique studios differentiate themselves through specialized training and strong community appeal. Competition encourages gyms to improve customer experience, introduce new programs, and maintain high service standards. Customer retention, brand loyalty, and location convenience are key competitive factors, pushing operators to continuously adapt to changing fitness preferences and lifestyle trends.

The major players for above market are:

  • Planet Fitness
  • Anytime Fitness
  • Gold’s Gym
  • 24 Hour Fitness
  • LA Fitness
  • Life Time Fitness
  • Equinox
  • Virgin Active
  • Snap Fitness
  • PureGym
  • Basic-Fit
  • The Gym Group
  • David Lloyd Leisure
  • GoodLife Fitness
  • Orangetheory Fitness
  • F45 Training
  • Xponential Fitness (owner of Club Pilates, Pure Barre & others)
  • Les Mills
  • Barry’s (formerly Barry’s Bootcamp)
  • CrossFit

Recent Development

  • In November 2025, UFC GYM, announced the grand opening of its premium fitness facility in Salt Lake, Kolkata. The expansive, state-of-the-art center became the city’s largest gym, introducing a new phase of fitness and MMA-inspired training while strengthening the brand’s presence in the region.


  • In September 2025, Anytime Fitness, the fastest-growing gym chain, with a strong global presence and extensive operations across India, partnered with AIRTH, a deep-tech startup incubated at IIT Bombay and IISc Bangalore, to launch the Clean Air Gym Movement, becoming India’s first fitness chain to establish Certified Clean Air Zones.


Frequently Asked Questions (FAQ) :

Q1. What are the main growth-driving factors for this market?

The primary drivers include rising health consciousness and a global increase in lifestyle-related chronic diseases. Consumers are prioritizing physical fitness and social interaction following pandemic lockdowns. Additionally, corporate wellness programs and the integration of high-tech equipment, such as biometric tracking and personalized AI coaching, are attracting a broader demographic to facilities.

Q2. What are the main restraining factors for this market?

Growth is hindered by high operational costs, including expensive urban real estate and energy consumption. The market also faces intense competition from digital fitness platforms and home-workout equipment, which offer lower-cost alternatives. Furthermore, a shortage of certified personal trainers and fluctuating consumer spending due to economic inflation can negatively impact membership.

Q3. Which segment is expected to witness high growth?

The boutique fitness studio segment is expected to witness the highest growth. These specialized facilities offer community-focused, high-intensity interval training (HIIT), yoga, or cycling classes. Their appeal lies in providing a premium, personalized experience and a strong sense of community, which traditional big-box gyms often lack, attracting younger, high-spending urban populations.

Q4. Who are the top major players for this market?

The market is led by global giants such as Anytime Fitness, 24 Hour Fitness, and Planet Fitness, which benefit from extensive franchising models. Other significant players include Gold’s Gym, Equinox Holdings, and Basic-Fit in Europe. These companies maintain dominance through aggressive geographic expansion, tiered membership pricing, and strategic brand partnerships.

Q5. Which country is the largest player?

The United States remains the largest player in the offline gyms market. This dominance is due to a mature fitness culture, high disposable income, and a vast network of established health clubs. The presence of major industry headquarters and a strong trend toward specialized boutique fitness further solidifies its market leadership.

Offline Gyms MARKET STUDY GLOBAL MARKET ANALYSIS, INSIGHTS AND FORECAST, 2022-2029

    1. Introduction

    • 1.1. Research Scope
    • 1.2. Market Segmentation
    • 1.3. Research Methodology
    • 1.4. Definitions and Assumptions

    2. Executive Summary

      3. Market Dynamics

      • 3.1. Market Drivers
      • 3.2. Market Restraints
      • 3.3. Market Opportunities

      4. Key Insights

      • 4.1. Key Emerging Trends – For Major Countries
      • 4.2. Latest Technological Advancement
      • 4.3. Regulatory Landscape
      • 4.4. Industry SWOT Analysis
      • 4.5. Porters Five Forces Analysis

      5. Global Offline Gyms Market Analysis (USD Billion), Insights and Forecast, 2018-2029

      • 5.1. Key Findings / Summary
      • 5.2. Market Analysis, Insights and Forecast – By Segment 1
        • 5.2.1. Sub-Segment 1
        • 5.2.2. Sub-Segment 2
      • 5.3. Market Analysis, Insights and Forecast – By Segment 2
        • 5.3.1. Sub-Segment 1
        • 5.3.2. Sub-Segment 2
        • 5.3.3. Sub-Segment 3
        • 5.3.4. Others
      • 5.4. Market Analysis, Insights and Forecast – By Segment 3
        • 5.4.1. Sub-Segment 1
        • 5.4.2. Sub-Segment 2
        • 5.4.3. Sub-Segment 3
        • 5.4.4. Others
      • 5.5. Market Analysis, Insights and Forecast – By Region
        • 5.5.1. North America
        • 5.5.2. Latin America
        • 5.5.3. Europe
        • 5.5.4. Asia Pacific
        • 5.5.5. Middle East and Africa

      6. North America Offline Gyms Market Analysis (USD Billion), Insights and Forecast, 2018-2029

      • 6.1. Key Findings / Summary
      • 6.2. Market Analysis, Insights and Forecast – By Segment 1
        • 6.2.1. Sub-Segment 1
        • 6.2.2. Sub-Segment 2
      • 6.3. Market Analysis, Insights and Forecast – By Segment 2
        • 6.3.1. Sub-Segment 1
        • 6.3.2. Sub-Segment 2
        • 6.3.3. Sub-Segment 3
        • 6.3.4. Others
      • 6.4. Market Analysis, Insights and Forecast – By Segment 3
        • 6.4.1. Sub-Segment 1
        • 6.4.2. Sub-Segment 2
        • 6.4.3. Sub-Segment 3
        • 6.4.4. Others
      • 6.5. Market Analysis, Insights and Forecast – By Country
        • 6.5.1. U.S.
        • 6.5.2. Canada

      7. Latin America Offline Gyms Market Analysis (USD Billion), Insights and Forecast, 2018-2029

      • 7.1. Key Findings / Summary
      • 7.2. Market Analysis, Insights and Forecast – By Segment 1
        • 7.2.1. Sub-Segment 1
        • 7.2.2. Sub-Segment 2
      • 7.3. Market Analysis, Insights and Forecast – By Segment 2
        • 7.3.1. Sub-Segment 1
        • 7.3.2. Sub-Segment 2
        • 7.3.3. Sub-Segment 3
        • 7.3.4. Others
      • 7.4. Market Analysis, Insights and Forecast – By Segment 3
        • 7.4.1. Sub-Segment 1
        • 7.4.2. Sub-Segment 2
        • 7.4.3. Sub-Segment 3
        • 7.4.4. Others
      • 7.5. Insights and Forecast – By Country
        • 7.5.1. Brazil
        • 7.5.2. Mexico
        • 7.5.3. Rest of Latin America

      8. Europe Offline Gyms Market Analysis (USD Billion), Insights and Forecast, 2018-2029

      • 8.1. Key Findings / Summary
      • 8.2. Market Analysis, Insights and Forecast – By Segment 1
        • 8.2.1. Sub-Segment 1
        • 8.2.2. Sub-Segment 2
      • 8.3. Market Analysis, Insights and Forecast – By Segment 2
        • 8.3.1. Sub-Segment 1
        • 8.3.2. Sub-Segment 2
        • 8.3.3. Sub-Segment 3
        • 8.3.4. Others
      • 8.4. Market Analysis, Insights and Forecast – By Segment 3
        • 8.4.1. Sub-Segment 1
        • 8.4.2. Sub-Segment 2
        • 8.4.3. Sub-Segment 3
        • 8.4.4. Others
      • 8.5. Market Analysis, Insights and Forecast – By Country
        • 8.5.1. UK
        • 8.5.2. Germany
        • 8.5.3. France
        • 8.5.4. Italy
        • 8.5.5. Spain
        • 8.5.6. Russia
        • 8.5.7. Rest of Europe

      9. Asia Pacific Offline Gyms Market Analysis (USD Billion), Insights and Forecast, 2018-2029

      • 9.1. Key Findings / Summary
      • 9.2. Market Analysis, Insights and Forecast – By Segment 1
        • 9.2.1. Sub-Segment 1
        • 9.2.2. Sub-Segment 2
      • 9.3. Market Analysis, Insights and Forecast – By Segment 2
        • 9.3.1. Sub-Segment 1
        • 9.3.2. Sub-Segment 2
        • 9.3.3. Sub-Segment 3
        • 9.3.4. Others
      • 9.4. Market Analysis, Insights and Forecast – By Segment 3
        • 9.4.1. Sub-Segment 1
        • 9.4.2. Sub-Segment 2
        • 9.4.3. Sub-Segment 3
        • 9.4.4. Others
      • 9.5. Market Analysis, Insights and Forecast – By Country
        • 9.5.1. China
        • 9.5.2. India
        • 9.5.3. Japan
        • 9.5.4. Australia
        • 9.5.5. South East Asia
        • 9.5.6. Rest of Asia Pacific

      10. Middle East & Africa Offline Gyms Market Analysis (USD Billion), Insights and Forecast, 2018-2029

      • 10.1. Key Findings / Summary
      • 10.2. Market Analysis, Insights and Forecast – By Segment 1
        • 10.2.1. Sub-Segment 1
        • 10.2.2. Sub-Segment 2
      • 10.3. Market Analysis, Insights and Forecast – By Segment 2
        • 10.3.1. Sub-Segment 1
        • 10.3.2. Sub-Segment 2
        • 10.3.3. Sub-Segment 3
        • 10.3.4. Others
      • 10.4. Market Analysis, Insights and Forecast – By Segment 3
        • 10.4.1. Sub-Segment 1
        • 10.4.2. Sub-Segment 2
        • 10.4.3. Sub-Segment 3
        • 10.4.4. Others
      • 10.5. Market Analysis, Insights and Forecast – By Country
        • 10.5.1. GCC
        • 10.5.2. South Africa
        • 10.5.3. Rest of Middle East & Africa

      11. Competitive Analysis

      • 11.1. Company Market Share Analysis, 2018
      • 11.2. Key Industry Developments
      • 11.3. Company Profile
        • 11.3.1. Company 1
          • 11.3.1.1. Business Overview
          • 11.3.1.2. Segment 1 & Service Offering
          • 11.3.1.3. Overall Revenue
          • 11.3.1.4. Geographic Presence
          • 11.3.1.5. Recent Development
        *Similar details will be provided for the following companies
        • 11.3.2. Company 2
        • 11.3.3. Company 3
        • 11.3.4. Company 4
        • 11.3.5. Company 5
        • 11.3.6. Company 6
        • 11.3.7. Company 7
        • 11.3.8. Company 8
        • 11.3.9. Company 9
        • 11.3.10. Company 10
        • 11.3.11. Company 11
        • 11.3.12. Company 12
      List of Figures

      Figure 1: Global Offline Gyms Market Revenue Breakdown (USD Billion, %) by Region, 2022 & 2029
      Figure 2: Global Offline Gyms Market Value Share (%), By Segment 1, 2022 & 2029
      Figure 3: Global Offline Gyms Market Forecast (USD Billion), by Sub-Segment 1, 2018-2029
      Figure 4: Global Offline Gyms Market Forecast (USD Billion), by Sub-Segment 2, 2018-2029
      Figure 5: Global Offline Gyms Market Value Share (%), By Segment 2, 2022 & 2029
      Figure 6: Global Offline Gyms Market Forecast (USD Billion), by Sub-Segment 1, 2018-2029
      Figure 7: Global Offline Gyms Market Forecast (USD Billion), by Sub-Segment 2, 2018-2029
      Figure 8: Global Offline Gyms Market Forecast (USD Billion), by Sub-Segment 3, 2018-2029
      Figure 9: Global Offline Gyms Market Forecast (USD Billion), by Others, 2018-2029
      Figure 10: Global Offline Gyms Market Value Share (%), By Segment 3, 2022 & 2029
      Figure 11: Global Offline Gyms Market Forecast (USD Billion), by Sub-Segment 1, 2018-2029
      Figure 12: Global Offline Gyms Market Forecast (USD Billion), by Sub-Segment 2, 2018-2029
      Figure 13: Global Offline Gyms Market Forecast (USD Billion), by Sub-Segment 3, 2018-2029
      Figure 14: Global Offline Gyms Market Forecast (USD Billion), by Others, 2018-2029
      Figure 15: Global Offline Gyms Market Value (USD Billion), by Region, 2022 & 2029
      Figure 16: North America Offline Gyms Market Value Share (%), By Segment 1, 2022 & 2029
      Figure 17: North America Offline Gyms Market Forecast (USD Billion), by Sub-Segment 1, 2018-2029
      Figure 18: North America Offline Gyms Market Forecast (USD Billion), by Sub-Segment 2, 2018-2029
      Figure 19: North America Offline Gyms Market Value Share (%), By Segment 2, 2022 & 2029
      Figure 20: North America Offline Gyms Market Forecast (USD Billion), by Sub-Segment 1, 2018-2029
      Figure 21: North America Offline Gyms Market Forecast (USD Billion), by Sub-Segment 2, 2018-2029
      Figure 22: North America Offline Gyms Market Forecast (USD Billion), by Sub-Segment 3, 2018-2029
      Figure 23: North America Offline Gyms Market Forecast (USD Billion), by Others, 2018-2029
      Figure 24: North America Offline Gyms Market Value Share (%), By Segment 3, 2022 & 2029
      Figure 25: North America Offline Gyms Market Forecast (USD Billion), by Sub-Segment 1, 2018-2029
      Figure 26: North America Offline Gyms Market Forecast (USD Billion), by Sub-Segment 2, 2018-2029
      Figure 27: North America Offline Gyms Market Forecast (USD Billion), by Sub-Segment 3, 2018-2029
      Figure 28: North America Offline Gyms Market Forecast (USD Billion), by Others, 2018-2029
      Figure 29: North America Offline Gyms Market Forecast (USD Billion), by U.S., 2018-2029
      Figure 30: North America Offline Gyms Market Forecast (USD Billion), by Canada, 2018-2029
      Figure 31: Latin America Offline Gyms Market Value Share (%), By Segment 1, 2022 & 2029
      Figure 32: Latin America Offline Gyms Market Forecast (USD Billion), by Sub-Segment 1, 2018-2029
      Figure 33: Latin America Offline Gyms Market Forecast (USD Billion), by Sub-Segment 2, 2018-2029
      Figure 34: Latin America Offline Gyms Market Value Share (%), By Segment 2, 2022 & 2029
      Figure 35: Latin America Offline Gyms Market Forecast (USD Billion), by Sub-Segment 1, 2018-2029
      Figure 36: Latin America Offline Gyms Market Forecast (USD Billion), by Sub-Segment 2, 2018-2029
      Figure 37: Latin America Offline Gyms Market Forecast (USD Billion), by Sub-Segment 3, 2018-2029
      Figure 38: Latin America Offline Gyms Market Forecast (USD Billion), by Others, 2018-2029
      Figure 39: Latin America Offline Gyms Market Value Share (%), By Segment 3, 2022 & 2029
      Figure 40: Latin America Offline Gyms Market Forecast (USD Billion), by Sub-Segment 1, 2018-2029
      Figure 41: Latin America Offline Gyms Market Forecast (USD Billion), by Sub-Segment 2, 2018-2029
      Figure 42: Latin America Offline Gyms Market Forecast (USD Billion), by Sub-Segment 3, 2018-2029
      Figure 43: Latin America Offline Gyms Market Forecast (USD Billion), by Others, 2018-2029
      Figure 44: Latin America Offline Gyms Market Forecast (USD Billion), by Brazil, 2018-2029
      Figure 45: Latin America Offline Gyms Market Forecast (USD Billion), by Mexico, 2018-2029
      Figure 46: Latin America Offline Gyms Market Forecast (USD Billion), by Rest of Latin America, 2018-2029
      Figure 47: Europe Offline Gyms Market Value Share (%), By Segment 1, 2022 & 2029
      Figure 48: Europe Offline Gyms Market Forecast (USD Billion), by Sub-Segment 1, 2018-2029
      Figure 49: Europe Offline Gyms Market Forecast (USD Billion), by Sub-Segment 2, 2018-2029
      Figure 50: Europe Offline Gyms Market Value Share (%), By Segment 2, 2022 & 2029
      Figure 51: Europe Offline Gyms Market Forecast (USD Billion), by Sub-Segment 1, 2018-2029
      Figure 52: Europe Offline Gyms Market Forecast (USD Billion), by Sub-Segment 2, 2018-2029
      Figure 53: Europe Offline Gyms Market Forecast (USD Billion), by Sub-Segment 3, 2018-2029
      Figure 54: Europe Offline Gyms Market Forecast (USD Billion), by Others, 2018-2029
      Figure 55: Europe Offline Gyms Market Value Share (%), By Segment 3, 2022 & 2029
      Figure 56: Europe Offline Gyms Market Forecast (USD Billion), by Sub-Segment 1, 2018-2029
      Figure 57: Europe Offline Gyms Market Forecast (USD Billion), by Sub-Segment 2, 2018-2029
      Figure 58: Europe Offline Gyms Market Forecast (USD Billion), by Sub-Segment 3, 2018-2029
      Figure 59: Europe Offline Gyms Market Forecast (USD Billion), by Others, 2018-2029
      Figure 60: Europe Offline Gyms Market Forecast (USD Billion), by U.K., 2018-2029
      Figure 61: Europe Offline Gyms Market Forecast (USD Billion), by Germany, 2018-2029
      Figure 62: Europe Offline Gyms Market Forecast (USD Billion), by France, 2018-2029
      Figure 63: Europe Offline Gyms Market Forecast (USD Billion), by Italy, 2018-2029
      Figure 64: Europe Offline Gyms Market Forecast (USD Billion), by Spain, 2018-2029
      Figure 65: Europe Offline Gyms Market Forecast (USD Billion), by Russia, 2018-2029
      Figure 66: Europe Offline Gyms Market Forecast (USD Billion), by Rest of Europe, 2018-2029
      Figure 67: Asia Pacific Offline Gyms Market Value Share (%), By Segment 1, 2022 & 2029
      Figure 68: Asia Pacific Offline Gyms Market Forecast (USD Billion), by Sub-Segment 1, 2018-2029
      Figure 69: Asia Pacific Offline Gyms Market Forecast (USD Billion), by Sub-Segment 2, 2018-2029
      Figure 70: Asia Pacific Offline Gyms Market Value Share (%), By Segment 2, 2022 & 2029
      Figure 71: Asia Pacific Offline Gyms Market Forecast (USD Billion), by Sub-Segment 1, 2018-2029
      Figure 72: Asia Pacific Offline Gyms Market Forecast (USD Billion), by Sub-Segment 2, 2018-2029
      Figure 73: Asia Pacific Offline Gyms Market Forecast (USD Billion), by Sub-Segment 3, 2018-2029
      Figure 74: Asia Pacific Offline Gyms Market Forecast (USD Billion), by Others, 2018-2029
      Figure 75: Asia Pacific Offline Gyms Market Value Share (%), By Segment 3, 2022 & 2029
      Figure 76: Asia Pacific Offline Gyms Market Forecast (USD Billion), by Sub-Segment 1, 2018-2029
      Figure 77: Asia Pacific Offline Gyms Market Forecast (USD Billion), by Sub-Segment 2, 2018-2029
      Figure 78: Asia Pacific Offline Gyms Market Forecast (USD Billion), by Sub-Segment 3, 2018-2029
      Figure 79: Asia Pacific Offline Gyms Market Forecast (USD Billion), by Others, 2018-2029
      Figure 80: Asia Pacific Offline Gyms Market Forecast (USD Billion), by China, 2018-2029
      Figure 81: Asia Pacific Offline Gyms Market Forecast (USD Billion), by India, 2018-2029
      Figure 82: Asia Pacific Offline Gyms Market Forecast (USD Billion), by Japan, 2018-2029
      Figure 83: Asia Pacific Offline Gyms Market Forecast (USD Billion), by Australia, 2018-2029
      Figure 84: Asia Pacific Offline Gyms Market Forecast (USD Billion), by Southeast Asia, 2018-2029
      Figure 85: Asia Pacific Offline Gyms Market Forecast (USD Billion), by Rest of Asia Pacific, 2018-2029
      Figure 86: Middle East & Africa Offline Gyms Market Value Share (%), By Segment 1, 2022 & 2029
      Figure 87: Middle East & Africa Offline Gyms Market Forecast (USD Billion), by Sub-Segment 1, 2018-2029
      Figure 88: Middle East & Africa Offline Gyms Market Forecast (USD Billion), by Sub-Segment 2, 2018-2029
      Figure 89: Middle East & Africa Offline Gyms Market Value Share (%), By Segment 2, 2022 & 2029
      Figure 90: Middle East & Africa Offline Gyms Market Forecast (USD Billion), by Sub-Segment 1, 2018-2029
      Figure 91: Middle East & Africa Offline Gyms Market Forecast (USD Billion), by Sub-Segment 2, 2018-2029
      Figure 92: Middle East & Africa Offline Gyms Market Forecast (USD Billion), by Sub-Segment 3, 2018-2029
      Figure 93: Middle East & Africa Offline Gyms Market Forecast (USD Billion), by Others, 2018-2029
      Figure 94: Middle East & Africa Offline Gyms Market Value Share (%), By Segment 3, 2022 & 2029
      Figure 95: Middle East & Africa Offline Gyms Market Forecast (USD Billion), by Sub-Segment 1, 2018-2029
      Figure 96: Middle East & Africa Offline Gyms Market Forecast (USD Billion), by Sub-Segment 2, 2018-2029
      Figure 97: Middle East & Africa Offline Gyms Market Forecast (USD Billion), by Sub-Segment 3, 2018-2029
      Figure 98: Middle East & Africa Offline Gyms Market Forecast (USD Billion), by Others, 2018-2029
      Figure 99: Middle East & Africa Offline Gyms Market Forecast (USD Billion), by GCC, 2018-2029
      Figure 100: Middle East & Africa Offline Gyms Market Forecast (USD Billion), by South Africa, 2018-2029
      Figure 101: Middle East & Africa Offline Gyms Market Forecast (USD Billion), by Rest of Middle East & Africa, 2018-2029 
      List of Tables
      Table 1: Global Offline Gyms Market Revenue (USD Billion) Forecast, by Segment 1, 2018-2029
      Table 2: Global Offline Gyms Market Revenue (USD Billion) Forecast, by Segment 2, 2018-2029
      Table 3: Global Offline Gyms Market Revenue (USD Billion) Forecast, by Segment 3, 2018-2029
      Table 4: Global Offline Gyms Market Revenue (USD Billion) Forecast, by Region, 2018-2029
      Table 5: North America Offline Gyms Market Revenue (USD Billion) Forecast, by Segment 1, 2018-2029
      Table 6: North America Offline Gyms Market Revenue (USD Billion) Forecast, by Segment 2, 2018-2029
      Table 7: North America Offline Gyms Market Revenue (USD Billion) Forecast, by Segment 3, 2018-2029
      Table 8: North America Offline Gyms Market Revenue (USD Billion) Forecast, by Country, 2018-2029
      Table 9: Europe Offline Gyms Market Revenue (USD Billion) Forecast, by Segment 1, 2018-2029
      Table 10: Europe Offline Gyms Market Revenue (USD Billion) Forecast, by Segment 2, 2018-2029
      Table 11: Europe Offline Gyms Market Revenue (USD Billion) Forecast, by Segment 3, 2018-2029
      Table 12: Europe Offline Gyms Market Revenue (USD Billion) Forecast, by Country, 2018-2029
      Table 13: Latin America Offline Gyms Market Revenue (USD Billion) Forecast, by Segment 1, 2018-2029
      Table 14: Latin America Offline Gyms Market Revenue (USD Billion) Forecast, by Segment 2, 2018-2029
      Table 15: Latin America Offline Gyms Market Revenue (USD Billion) Forecast, by Segment 3, 2018-2029
      Table 16: Latin America Offline Gyms Market Revenue (USD Billion) Forecast, by Country, 2018-2029
      Table 17: Asia Pacific Offline Gyms Market Revenue (USD Billion) Forecast, by Segment 1, 2018-2029
      Table 18: Asia Pacific Offline Gyms Market Revenue (USD Billion) Forecast, by Segment 2, 2018-2029
      Table 19: Asia Pacific Offline Gyms Market Revenue (USD Billion) Forecast, by Segment 3, 2018-2029
      Table 20: Asia Pacific Offline Gyms Market Revenue (USD Billion) Forecast, by Country, 2018-2029
      Table 21: Middle East & Africa Offline Gyms Market Revenue (USD Billion) Forecast, by Segment 1, 2018-2029
      Table 22: Middle East & Africa Offline Gyms Market Revenue (USD Billion) Forecast, by Segment 2, 2018-2029
      Table 23: Middle East & Africa Offline Gyms Market Revenue (USD Billion) Forecast, by Segment 3, 2018-2029
      Table 24: Middle East & Africa Offline Gyms Market Revenue (USD Billion) Forecast, by Country, 2018-2029
      Research Process

      Data Library Research are conducted by industry experts who offer insight on industry structure, market segmentations technology assessment and competitive landscape (CL), and penetration, as well as on emerging trends. Their analysis is based on primary interviews (~ 80%) and secondary research (~ 20%) as well as years of professional expertise in their respective industries. Adding to this, by analysing historical trends and current market positions, our analysts predict where the market will be headed for the next five years. Furthermore, the varying trends of segment & categories geographically presented are also studied and the estimated based on the primary & secondary research.

      In this particular report from the supply side Data Library Research has conducted primary surveys (interviews) with the key level executives (VP, CEO’s, Marketing Director, Business Development Manager and SOFT) of the companies that active & prominent as well as the midsized organization

      FIGURE 1: DLR RESEARH PROCESS

      research-methodology1

      Primary Research

      Extensive primary research was conducted to gain a deeper insight of the market and industry performance. The analysis is based on both primary and secondary research as well as years of professional expertise in the respective industries.

      In addition to analysing current and historical trends, our analysts predict where the market is headed over the next five years.

      It varies by segment for these categories geographically presented in the list of market tables. Speaking about this particular report we have conducted primary surveys (interviews) with the key level executives (VP, CEO’s, Marketing Director, Business Development Manager and many more) of the major players active in the market.

      Secondary Research

      Secondary research was mainly used to collect and identify information useful for the extensive, technical, market-oriented, and Friend’s study of the Global Extra Neutral Alcohol. It was also used to obtain key information about major players, market classification and segmentation according to the industry trends, geographical markets, and developments related to the market and technology perspectives. For this study, analysts have gathered information from various credible sources, such as annual reports, sec filings, journals, white papers, SOFT presentations, and company web sites.

      Market Size Estimation

      Both, top-down and bottom-up approaches were used to estimate and validate the size of the Global market and to estimate the size of various other dependent submarkets in the overall Extra Neutral Alcohol. The key players in the market were identified through secondary research and their market contributions in the respective geographies were determined through primary and secondary research.

      Forecast Model

      research-methodology2