Printed Electronics in Healthcare Market Overview and Analysis

  • The Global Printed Electronics Market is projected to grow from USD 21.46 billion in 2025 to USD 45.85 billion by 2032, at a CAGR of 14.16% from 2025-2032.

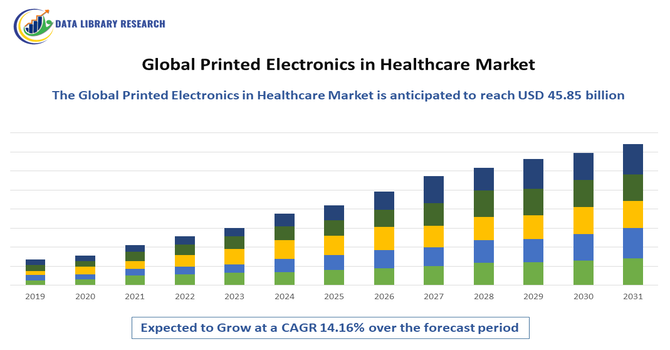
The Global Printed Electronics in Healthcare Market refers to the rapidly growing sector focused on the development and application of printed electronic technologies—such as flexible sensors, wearable devices, smart patches, and diagnostic tools—specifically designed for use in healthcare settings. Utilizing printing techniques like inkjet, screen, and gravure printing on flexible substrates, these technologies enable lightweight, low-cost, and scalable medical solutions for real-time patient monitoring, drug delivery, and diagnostics. Driven by increasing demand for remote healthcare, wearable health tech, and advancements in materials science, this market is gaining traction worldwide, especially in areas prioritizing digital health transformation and personalized medicine.

Printed Electronics in Healthcare Market Latest Trends

 The trends in the Global Printed Electronics in Healthcare Market include the rising adoption of wearable health monitoring devices, such as smart patches and biosensors, driven by growing demand for remote patient monitoring and personalized healthcare. Advances in flexible and stretchable electronics are enabling the development of lightweight, skin-conformable devices that improve patient comfort and compliance. Additionally, the integration of printed electronics with IoT and AI technologies is enhancing real-time health data collection and analytics. Increasing investments in R&D, collaborations between tech and healthcare companies, and a shift toward minimally invasive diagnostic tools are also accelerating market growth.

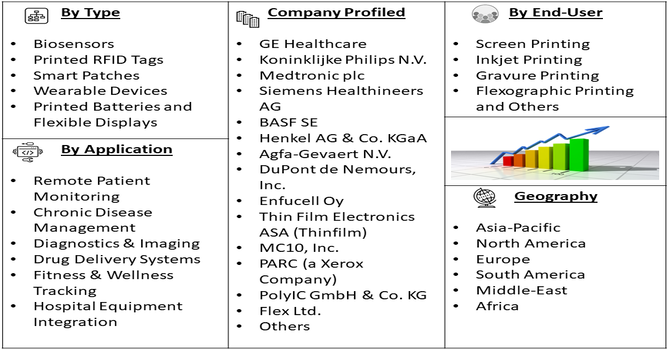
Segmentation: The Global Printed Electronics in Healthcare Market is Segmented by Product Type (Biosensors, Printed RFID Tags, Smart Patches, Wearable Devices, Printed Batteries, and Flexible Displays), Technology (Screen Printing, Inkjet Printing, Gravure Printing, Flexographic Printing, and Others), Application (Remote Patient Monitoring, Chronic Disease Management, Diagnostics & Imaging, Drug Delivery Systems, Fitness & Wellness Tracking, and Hospital Equipment Integration), and Geography (North America, Europe, Asia-Pacific, Latin America, Middle East & Africa). The report provides the value (in USD million) for the above segments.

Market Drivers:

  • Rising Demand for Wearable and Remote Health Monitoring Devices

The increasing prevalence of chronic diseases, aging populations, and a global shift toward value-based care are driving the demand for wearable and remote patient monitoring devices. Printed electronics enable lightweight, flexible, and skin-friendly sensors that can continuously monitor vital signs such as heart rate, glucose levels, and body temperature. These devices enhance patient comfort and allow real-time data collection without the need for hospital visits. Printed electronics provide a cost-effective and scalable solution, supporting the growing emphasis on home healthcare, telemedicine, and personalized treatment, especially in resource-constrained settings and remote areas where traditional healthcare infrastructure may be lacking.

Moreover, the product innovations by various major players are also fuelling the market growth. For instance, in October 2025, Empatica acquired PKG Health, a leader in movement disorder algorithms and digital endpoints for Parkinson’s disease. The acquisition enhanced Empatica’s FDA-cleared wearable technology platform with validated algorithms, expanding its presence in neurology research, clinical care, and diagnostics. The acquisition strengthened the integration of advanced algorithms with wearable printed electronics, enhancing remote monitoring for neurological disorders. This development expanded market opportunities for printed electronics in personalized healthcare and clinical diagnostics.

  • Advancements in Printing Technologies and Materials

Significant advancements in materials science and printing technologies are propelling the growth of printed electronics in healthcare. Innovations in conductive inks, biocompatible substrates, and printing methods such as inkjet, screen, and gravure printing are enabling high-performance electronic components that are flexible, stretchable, and even biodegradable. These technological improvements support the mass production of highly customized medical devices at lower costs and with minimal material waste. The ability to print sensors directly onto flexible materials or integrate them into textiles opens new avenues for smart bandages, ingestible devices, and on-skin diagnostics. These breakthroughs are making printed electronics more accessible and reliable, thus fueling their adoption in diverse healthcare applications ranging from diagnostics to therapeutic monitoring.

Market Restraints:

  • Regulatory Challenges and Standardization Issues

Despite its promise, the printed electronics in healthcare market faces significant regulatory and standardization challenges. Medical devices incorporating printed electronics must comply with stringent safety, reliability, and biocompatibility standards, which vary across countries. The lack of harmonized regulatory frameworks can slow product approvals and create barriers for global market entry. Moreover, many printed electronic components are still relatively new, lacking long-term performance data, which complicates the approval process by health authorities such as the FDA or EMA. In addition, the absence of industry-wide standards for testing, quality control, and interoperability increases development costs and hinders integration with existing healthcare systems. These regulatory uncertainties can delay commercialization and discourage smaller companies from investing in innovative printed healthcare technologies.

Socio Economic Impact on Printed Electronics in Healthcare Market

The socio-economic impact of the Global Printed Electronics in Healthcare Market is substantial, as it contributes to more accessible, affordable, and personalized healthcare solutions worldwide. By enabling the mass production of low-cost, flexible medical devices such as wearable sensors, diagnostic patches, and remote monitoring tools, printed electronics help bridge healthcare gaps, particularly in underserved and rural regions. This technology supports early disease detection and continuous monitoring, reducing hospital admissions and lowering healthcare costs. It also empowers patients to manage chronic conditions independently, improving quality of life and reducing caregiver burdens. Additionally, the market stimulates economic growth by creating new jobs in healthcare technology, advanced manufacturing, and R&D, while fostering innovation and cross-sector collaboration between electronics and medical industries.

Segmental Analysis:

  • Printed Batteries Segment is Expected to Witness Significant Growth Over the Forecast Period

The printed batteries segment is poised for significant growth due to increasing demand for lightweight, flexible, and compact power sources in wearable healthcare devices. Printed batteries are ideal for powering biosensors, smart patches, and implantable devices, offering benefits such as low production costs, thin form factors, and integration with flexible substrates. As the healthcare industry continues to shift toward remote monitoring and personalized care, the need for self-powered or low-energy medical devices is accelerating. Printed batteries provide an environmentally friendly and scalable energy solution, particularly for disposable medical electronics. Continuous advancements in printing techniques and materials, such as solid-state electrolytes and zinc-based chemistries, are further enhancing performance and safety, making printed batteries a critical enabler in the future of digital healthcare.

  • Flexographic Printing Segment is Expected to Witness Significant Growth Over the Forecast Period

Flexographic printing is expected to witness significant growth in the printed electronics healthcare market due to its high-speed production capability, scalability, and cost-efficiency. This technique uses flexible plates and fast-drying inks, making it well-suited for producing large volumes of medical devices such as smart packaging, wearable patches, and printed sensors. Its ability to print on a wide range of substrates—including flexible plastics and bio-compatible materials—makes it ideal for developing next-generation healthcare electronics. Moreover, flexographic printing supports multi-layer and complex circuitry designs essential for advanced diagnostics and monitoring applications. As healthcare providers seek to lower costs while increasing accessibility, flexographic printing offers a reliable solution for mass manufacturing of low-cost, high-performance medical electronics, particularly in emerging markets and large-scale public health deployments.

  • Remote Patient Monitoring Segment is Expected to Witness Significant Growth Over the Forecast Period

Remote patient monitoring (RPM) is projected to be one of the fastest-growing application segments in the printed electronics in healthcare market, driven by the rising prevalence of chronic diseases, aging populations, and the growing need for home-based care. Printed electronics enable the creation of comfortable, non-invasive, and disposable devices such as wearable biosensors, ECG patches, and temperature monitors that continuously collect patient data. This allows for real-time health tracking, early detection of complications, and reduced hospital readmissions.

The COVID-19 pandemic accelerated adoption of RPM solutions, and the trend continues due to the convenience, cost savings, and improved patient outcomes they offer. Printed electronics make RPM devices more affordable and scalable, enabling wider deployment in both developed and resource-limited healthcare settings. In October 2025, Tenovi, entered in partnership with Lōvu Health. This partnership accelerated the adoption of remote monitoring technologies in maternal healthcare, driving demand for printed electronics-based wearable devices. It highlighted the market’s potential for personalized, real-time health tracking solutions in specialized healthcare segments. Thus, such factors together are fuelling the market growth.

  • North America Region is Expected to Witness Significant Growth Over the Forecast Period

North America is expected to witness significant growth in the printed electronics in healthcare market, primarily due to its advanced healthcare infrastructure, high adoption of digital health technologies, and strong investment in research and development. The region is home to several key market players, tech startups, and academic institutions driving innovation in printed electronics and flexible medical devices. Government support for healthcare innovation, combined with growing demand for wearable and remote monitoring devices, further fuels market expansion. The increasing prevalence of chronic conditions such as diabetes and cardiovascular diseases, along with a tech-savvy population, is also contributing to rapid adoption. For instance, in December 2024, Interlink Electronics, Inc. Conductive Transfers Limited (CT) and Global Print Solutions Limited (GPS), gaining valuable printing equipment and patented processes for integrating electronics with textiles. CT and GPS had a strong track record in developing e-textiles and wearable technology, including heaters for clothing and Functional Electrical Stimulation electrodes for stroke rehabilitation, along with sensors for healthcare and automotive applications. This acquisition strengthens North America's leadership in printed electronics by expanding advanced e-textile and wearable healthcare technologies. It accelerates innovation and production capabilities, boosting adoption of flexible, sensor-integrated medical devices in the region. Additionally, favorable regulatory frameworks and rising awareness about personalized medicine are making North America a key hub for printed healthcare electronics deployment and commercialization

Printed Electronics in Healthcare Market Competitive Landscape

The competitive landscape of the Global Printed Electronics in Healthcare Market is dynamic and fragmented, characterized by a mix of established technology conglomerates, specialized printed electronics firms, and traditional medical device manufacturers. Key players, such as Jabil Inc., Flex Ltd., Abbott Laboratories (for its FreeStyle Libre sensors), Medtronic plc (for printed electrodes), E Ink Holdings Inc., and material suppliers like DuPont de Nemours, Inc. and Henkel AG and Co. KGaA, compete primarily on technological innovation, product miniaturization, and cost-effectiveness. The central competitive strategies revolve around extensive R&D to develop more flexible, stretchable, and bio-compatible materials, forming strategic partnerships and collaborations (e.g., between material providers and end-product manufacturers), and focusing on high-growth applications like wearable sensors for remote patient monitoring and point-of-care diagnostics (such as printed biosensors for glucose monitoring). The market is also seeing rising competition from new entrants and start-ups that specialize in next-generation printing technologies like aerosol jet printing and 3D printing. Overcoming industry challenges such as high initial investment costs, the complexity of regulatory approval (FDA/EMA validation), and ensuring product durability and biocompatibility are crucial factors for companies to gain a competitive edge and secure a larger market share.

The 10 major players for above market are

  • GE Healthcare
  • Koninklijke Philips N.V.
  • Medtronic plc
  • Siemens Healthineers AG
  • BASF SE
  • Henkel AG & Co. KGaA
  • Agfa-Gevaert N.V.
  • DuPont de Nemours, Inc.
  • Enfucell Oy
  • Thin Film Electronics ASA (Thinfilm)
  • MC10, Inc.
  • PARC (a Xerox Company)
  • PolyIC GmbH & Co. KG
  • Flex Ltd.
  • OLEDWorks LLC
  • ISORG
  • T+Ink, Inc.
  • PragmatIC Semiconductor Ltd.
  • NovaCentrix
  • Blue Spark Technologies, Inc

Recent News:

  • In November 2024, Henkel and Linxens collaborated to drive the integration of advanced technologies for medical wearables based on printed electronics. As part of the partnership, the companies developed a proof of concept that integrated self-regulating heating elements into medical wearable devices, significantly enhancing wear comfort for patients. The partners aimed to launch this innovative proof of concept in the healthcare market and showcased demonstrations at the MEDICA trade show in Düsseldorf, Germany.


  • In November 2024, Henkel, Covestro, and Quad Industries entered into a partnership in the field of printed electronics, combining their respective areas of expertise to accelerate customer developments in advanced medical wearables and promote the adoption of innovative printed electronics solutions, particularly for stretchable materials in healthcare applications. The partners demonstrated their capabilities and showcased various demonstrators at the MEDICA trade show in Düsseldorf, Germany.


Frequently Asked Questions (FAQ) :

Q1. What are the main growth driving factors for this market?

The main growth drivers are the increasing demand for flexible, lightweight, and cost-effective medical devices, particularly for remote patient monitoring and wearable healthcare technologies. Printed electronics enable the development of smart patches and biosensors for continuous, non-invasive health tracking. Furthermore, technological advancements in printing, like high-precision inkjet technology and innovations in conductive inks, support more affordable and personalized manufacturing, fueling market expansion.

Q2. What are the main restraining factors for this market?

The market is primarily restrained by performance limitations, such as lower durability, conductivity, and environmental resistance compared to traditional silicon-based electronics. A significant challenge is the lack of uniform quality standards, interoperability protocols, and testing methodologies for mass-scale medical applications. Additionally, the complex and new manufacturing processes can be expensive, limiting the economies of scale and commercialization.

Q3. Which segment is expected to witness high growth?

The Home Healthcare & Remote Monitoring (RPM) end-user segment is expected to witness high growth. This is driven by the aging population, rising chronic diseases, and the preference for home-based care. Printed electronics are crucial for developing the portable and easy-to-use wearable devices, like smart patches and sensors, that enable continuous health data collection and remote patient management, thereby improving patient outcomes.

Q4. Who are the top major players for this market?

Major players in the broader printed electronics market, with significant presence in healthcare, include material and chemical suppliers such as DuPont de Nemours, Inc. and BASF SE. Other key companies with a strong focus on printed electronic devices and components for healthcare are Jabil Inc., Flex Ltd., GE Healthcare, Henkel AG & Co. KGaA, and Molex LLC.

Q5. Which country is the largest player?

The Asia Pacific region is generally anticipated to hold the largest market share in the global printed electronics market, with countries like China, Japan, and South Korea being key contributors due to significant investments in healthcare technology and a strong electronics manufacturing base. In 2024, the Asia Pacific region accounted for approximately 40% of the flexible electronics in the healthcare market.

Printed Electronics in Healthcare MARKET STUDY GLOBAL MARKET ANALYSIS, INSIGHTS AND FORECAST, 2023-2029

    1. Introduction

    • 1.1. Research Scope
    • 1.2. Market Segmentation
    • 1.3. Research Methodology
    • 1.4. Definitions and Assumptions

    2. Executive Summary

      3. Market Dynamics

      • 3.1. Market Drivers
      • 3.2. Market Restraints
      • 3.3. Market Opportunities

      4. Key Insights

      • 4.1. Key Emerging Trends – For Major Countries
      • 4.2. Latest Technological Advancement
      • 4.3. Regulatory Landscape
      • 4.4. Industry SWOT Analysis
      • 4.5. Porters Five Forces Analysis

      5. Global Printed Electronics in Healthcare Market Analysis (USD Billion), Insights and Forecast, 2018-2029

      • 5.1. Key Findings / Summary
      • 5.2. Market Analysis, Insights and Forecast – By Segment 1
        • 5.2.1. Sub-Segment 1
        • 5.2.2. Sub-Segment 2
      • 5.3. Market Analysis, Insights and Forecast – By Segment 2
        • 5.3.1. Sub-Segment 1
        • 5.3.2. Sub-Segment 2
        • 5.3.3. Sub-Segment 3
        • 5.3.4. Others
      • 5.4. Market Analysis, Insights and Forecast – By Segment 3
        • 5.4.1. Sub-Segment 1
        • 5.4.2. Sub-Segment 2
        • 5.4.3. Sub-Segment 3
        • 5.4.4. Others
      • 5.5. Market Analysis, Insights and Forecast – By Region
        • 5.5.1. North America
        • 5.5.2. Latin America
        • 5.5.3. Europe
        • 5.5.4. Asia Pacific
        • 5.5.5. Middle East and Africa

      6. North America Printed Electronics in Healthcare Market Analysis (USD Billion), Insights and Forecast, 2018-2029

      • 6.1. Key Findings / Summary
      • 6.2. Market Analysis, Insights and Forecast – By Segment 1
        • 6.2.1. Sub-Segment 1
        • 6.2.2. Sub-Segment 2
      • 6.3. Market Analysis, Insights and Forecast – By Segment 2
        • 6.3.1. Sub-Segment 1
        • 6.3.2. Sub-Segment 2
        • 6.3.3. Sub-Segment 3
        • 6.3.4. Others
      • 6.4. Market Analysis, Insights and Forecast – By Segment 3
        • 6.4.1. Sub-Segment 1
        • 6.4.2. Sub-Segment 2
        • 6.4.3. Sub-Segment 3
        • 6.4.4. Others
      • 6.5. Market Analysis, Insights and Forecast – By Country
        • 6.5.1. U.S.
        • 6.5.2. Canada

      7. Latin America Printed Electronics in Healthcare Market Analysis (USD Billion), Insights and Forecast, 2018-2029

      • 7.1. Key Findings / Summary
      • 7.2. Market Analysis, Insights and Forecast – By Segment 1
        • 7.2.1. Sub-Segment 1
        • 7.2.2. Sub-Segment 2
      • 7.3. Market Analysis, Insights and Forecast – By Segment 2
        • 7.3.1. Sub-Segment 1
        • 7.3.2. Sub-Segment 2
        • 7.3.3. Sub-Segment 3
        • 7.3.4. Others
      • 7.4. Market Analysis, Insights and Forecast – By Segment 3
        • 7.4.1. Sub-Segment 1
        • 7.4.2. Sub-Segment 2
        • 7.4.3. Sub-Segment 3
        • 7.4.4. Others
      • 7.5. Insights and Forecast – By Country
        • 7.5.1. Brazil
        • 7.5.2. Mexico
        • 7.5.3. Rest of Latin America

      8. Europe Printed Electronics in Healthcare Market Analysis (USD Billion), Insights and Forecast, 2018-2029

      • 8.1. Key Findings / Summary
      • 8.2. Market Analysis, Insights and Forecast – By Segment 1
        • 8.2.1. Sub-Segment 1
        • 8.2.2. Sub-Segment 2
      • 8.3. Market Analysis, Insights and Forecast – By Segment 2
        • 8.3.1. Sub-Segment 1
        • 8.3.2. Sub-Segment 2
        • 8.3.3. Sub-Segment 3
        • 8.3.4. Others
      • 8.4. Market Analysis, Insights and Forecast – By Segment 3
        • 8.4.1. Sub-Segment 1
        • 8.4.2. Sub-Segment 2
        • 8.4.3. Sub-Segment 3
        • 8.4.4. Others
      • 8.5. Market Analysis, Insights and Forecast – By Country
        • 8.5.1. UK
        • 8.5.2. Germany
        • 8.5.3. France
        • 8.5.4. Italy
        • 8.5.5. Spain
        • 8.5.6. Russia
        • 8.5.7. Rest of Europe

      9. Asia Pacific Printed Electronics in Healthcare Market Analysis (USD Billion), Insights and Forecast, 2018-2029

      • 9.1. Key Findings / Summary
      • 9.2. Market Analysis, Insights and Forecast – By Segment 1
        • 9.2.1. Sub-Segment 1
        • 9.2.2. Sub-Segment 2
      • 9.3. Market Analysis, Insights and Forecast – By Segment 2
        • 9.3.1. Sub-Segment 1
        • 9.3.2. Sub-Segment 2
        • 9.3.3. Sub-Segment 3
        • 9.3.4. Others
      • 9.4. Market Analysis, Insights and Forecast – By Segment 3
        • 9.4.1. Sub-Segment 1
        • 9.4.2. Sub-Segment 2
        • 9.4.3. Sub-Segment 3
        • 9.4.4. Others
      • 9.5. Market Analysis, Insights and Forecast – By Country
        • 9.5.1. China
        • 9.5.2. India
        • 9.5.3. Japan
        • 9.5.4. Australia
        • 9.5.5. South East Asia
        • 9.5.6. Rest of Asia Pacific

      10. Middle East & Africa Printed Electronics in Healthcare Market Analysis (USD Billion), Insights and Forecast, 2018-2029

      • 10.1. Key Findings / Summary
      • 10.2. Market Analysis, Insights and Forecast – By Segment 1
        • 10.2.1. Sub-Segment 1
        • 10.2.2. Sub-Segment 2
      • 10.3. Market Analysis, Insights and Forecast – By Segment 2
        • 10.3.1. Sub-Segment 1
        • 10.3.2. Sub-Segment 2
        • 10.3.3. Sub-Segment 3
        • 10.3.4. Others
      • 10.4. Market Analysis, Insights and Forecast – By Segment 3
        • 10.4.1. Sub-Segment 1
        • 10.4.2. Sub-Segment 2
        • 10.4.3. Sub-Segment 3
        • 10.4.4. Others
      • 10.5. Market Analysis, Insights and Forecast – By Country
        • 10.5.1. GCC
        • 10.5.2. South Africa
        • 10.5.3. Rest of Middle East & Africa

      11. Competitive Analysis

      • 11.1. Company Market Share Analysis, 2018
      • 11.2. Key Industry Developments
      • 11.3. Company Profile
        • 11.3.1. Company 1
          • 11.3.1.1. Business Overview
          • 11.3.1.2. Segment 1 & Service Offering
          • 11.3.1.3. Overall Revenue
          • 11.3.1.4. Geographic Presence
          • 11.3.1.5. Recent Development
        *Similar details will be provided for the following companies
        • 11.3.2. Company 2
        • 11.3.3. Company 3
        • 11.3.4. Company 4
        • 11.3.5. Company 5
        • 11.3.6. Company 6
        • 11.3.7. Company 7
        • 11.3.8. Company 8
        • 11.3.9. Company 9
        • 11.3.10. Company 10
        • 11.3.11. Company 11
        • 11.3.12. Company 12
      List of Figures

      Figure 1: Global Printed Electronics in Healthcare Market Revenue Breakdown (USD Billion, %) by Region, 2023 & 2029
      Figure 2: Global Printed Electronics in Healthcare Market Value Share (%), By Segment 1, 2023 & 2029
      Figure 3: Global Printed Electronics in Healthcare Market Forecast (USD Billion), by Sub-Segment 1, 2018-2029
      Figure 4: Global Printed Electronics in Healthcare Market Forecast (USD Billion), by Sub-Segment 2, 2018-2029
      Figure 5: Global Printed Electronics in Healthcare Market Value Share (%), By Segment 2, 2023 & 2029
      Figure 6: Global Printed Electronics in Healthcare Market Forecast (USD Billion), by Sub-Segment 1, 2018-2029
      Figure 7: Global Printed Electronics in Healthcare Market Forecast (USD Billion), by Sub-Segment 2, 2018-2029
      Figure 8: Global Printed Electronics in Healthcare Market Forecast (USD Billion), by Sub-Segment 3, 2018-2029
      Figure 9: Global Printed Electronics in Healthcare Market Forecast (USD Billion), by Others, 2018-2029
      Figure 10: Global Printed Electronics in Healthcare Market Value Share (%), By Segment 3, 2023 & 2029
      Figure 11: Global Printed Electronics in Healthcare Market Forecast (USD Billion), by Sub-Segment 1, 2018-2029
      Figure 12: Global Printed Electronics in Healthcare Market Forecast (USD Billion), by Sub-Segment 2, 2018-2029
      Figure 13: Global Printed Electronics in Healthcare Market Forecast (USD Billion), by Sub-Segment 3, 2018-2029
      Figure 14: Global Printed Electronics in Healthcare Market Forecast (USD Billion), by Others, 2018-2029
      Figure 15: Global Printed Electronics in Healthcare Market Value (USD Billion), by Region, 2023 & 2029
      Figure 16: North America Printed Electronics in Healthcare Market Value Share (%), By Segment 1, 2023 & 2029
      Figure 17: North America Printed Electronics in Healthcare Market Forecast (USD Billion), by Sub-Segment 1, 2018-2029
      Figure 18: North America Printed Electronics in Healthcare Market Forecast (USD Billion), by Sub-Segment 2, 2018-2029
      Figure 19: North America Printed Electronics in Healthcare Market Value Share (%), By Segment 2, 2023 & 2029
      Figure 20: North America Printed Electronics in Healthcare Market Forecast (USD Billion), by Sub-Segment 1, 2018-2029
      Figure 21: North America Printed Electronics in Healthcare Market Forecast (USD Billion), by Sub-Segment 2, 2018-2029
      Figure 22: North America Printed Electronics in Healthcare Market Forecast (USD Billion), by Sub-Segment 3, 2018-2029
      Figure 23: North America Printed Electronics in Healthcare Market Forecast (USD Billion), by Others, 2018-2029
      Figure 24: North America Printed Electronics in Healthcare Market Value Share (%), By Segment 3, 2023 & 2029
      Figure 25: North America Printed Electronics in Healthcare Market Forecast (USD Billion), by Sub-Segment 1, 2018-2029
      Figure 26: North America Printed Electronics in Healthcare Market Forecast (USD Billion), by Sub-Segment 2, 2018-2029
      Figure 27: North America Printed Electronics in Healthcare Market Forecast (USD Billion), by Sub-Segment 3, 2018-2029
      Figure 28: North America Printed Electronics in Healthcare Market Forecast (USD Billion), by Others, 2018-2029
      Figure 29: North America Printed Electronics in Healthcare Market Forecast (USD Billion), by U.S., 2018-2029
      Figure 30: North America Printed Electronics in Healthcare Market Forecast (USD Billion), by Canada, 2018-2029
      Figure 31: Latin America Printed Electronics in Healthcare Market Value Share (%), By Segment 1, 2023 & 2029
      Figure 32: Latin America Printed Electronics in Healthcare Market Forecast (USD Billion), by Sub-Segment 1, 2018-2029
      Figure 33: Latin America Printed Electronics in Healthcare Market Forecast (USD Billion), by Sub-Segment 2, 2018-2029
      Figure 34: Latin America Printed Electronics in Healthcare Market Value Share (%), By Segment 2, 2023 & 2029
      Figure 35: Latin America Printed Electronics in Healthcare Market Forecast (USD Billion), by Sub-Segment 1, 2018-2029
      Figure 36: Latin America Printed Electronics in Healthcare Market Forecast (USD Billion), by Sub-Segment 2, 2018-2029
      Figure 37: Latin America Printed Electronics in Healthcare Market Forecast (USD Billion), by Sub-Segment 3, 2018-2029
      Figure 38: Latin America Printed Electronics in Healthcare Market Forecast (USD Billion), by Others, 2018-2029
      Figure 39: Latin America Printed Electronics in Healthcare Market Value Share (%), By Segment 3, 2023 & 2029
      Figure 40: Latin America Printed Electronics in Healthcare Market Forecast (USD Billion), by Sub-Segment 1, 2018-2029
      Figure 41: Latin America Printed Electronics in Healthcare Market Forecast (USD Billion), by Sub-Segment 2, 2018-2029
      Figure 42: Latin America Printed Electronics in Healthcare Market Forecast (USD Billion), by Sub-Segment 3, 2018-2029
      Figure 43: Latin America Printed Electronics in Healthcare Market Forecast (USD Billion), by Others, 2018-2029
      Figure 44: Latin America Printed Electronics in Healthcare Market Forecast (USD Billion), by Brazil, 2018-2029
      Figure 45: Latin America Printed Electronics in Healthcare Market Forecast (USD Billion), by Mexico, 2018-2029
      Figure 46: Latin America Printed Electronics in Healthcare Market Forecast (USD Billion), by Rest of Latin America, 2018-2029
      Figure 47: Europe Printed Electronics in Healthcare Market Value Share (%), By Segment 1, 2023 & 2029
      Figure 48: Europe Printed Electronics in Healthcare Market Forecast (USD Billion), by Sub-Segment 1, 2018-2029
      Figure 49: Europe Printed Electronics in Healthcare Market Forecast (USD Billion), by Sub-Segment 2, 2018-2029
      Figure 50: Europe Printed Electronics in Healthcare Market Value Share (%), By Segment 2, 2023 & 2029
      Figure 51: Europe Printed Electronics in Healthcare Market Forecast (USD Billion), by Sub-Segment 1, 2018-2029
      Figure 52: Europe Printed Electronics in Healthcare Market Forecast (USD Billion), by Sub-Segment 2, 2018-2029
      Figure 53: Europe Printed Electronics in Healthcare Market Forecast (USD Billion), by Sub-Segment 3, 2018-2029
      Figure 54: Europe Printed Electronics in Healthcare Market Forecast (USD Billion), by Others, 2018-2029
      Figure 55: Europe Printed Electronics in Healthcare Market Value Share (%), By Segment 3, 2023 & 2029
      Figure 56: Europe Printed Electronics in Healthcare Market Forecast (USD Billion), by Sub-Segment 1, 2018-2029
      Figure 57: Europe Printed Electronics in Healthcare Market Forecast (USD Billion), by Sub-Segment 2, 2018-2029
      Figure 58: Europe Printed Electronics in Healthcare Market Forecast (USD Billion), by Sub-Segment 3, 2018-2029
      Figure 59: Europe Printed Electronics in Healthcare Market Forecast (USD Billion), by Others, 2018-2029
      Figure 60: Europe Printed Electronics in Healthcare Market Forecast (USD Billion), by U.K., 2018-2029
      Figure 61: Europe Printed Electronics in Healthcare Market Forecast (USD Billion), by Germany, 2018-2029
      Figure 62: Europe Printed Electronics in Healthcare Market Forecast (USD Billion), by France, 2018-2029
      Figure 63: Europe Printed Electronics in Healthcare Market Forecast (USD Billion), by Italy, 2018-2029
      Figure 64: Europe Printed Electronics in Healthcare Market Forecast (USD Billion), by Spain, 2018-2029
      Figure 65: Europe Printed Electronics in Healthcare Market Forecast (USD Billion), by Russia, 2018-2029
      Figure 66: Europe Printed Electronics in Healthcare Market Forecast (USD Billion), by Rest of Europe, 2018-2029
      Figure 67: Asia Pacific Printed Electronics in Healthcare Market Value Share (%), By Segment 1, 2023 & 2029
      Figure 68: Asia Pacific Printed Electronics in Healthcare Market Forecast (USD Billion), by Sub-Segment 1, 2018-2029
      Figure 69: Asia Pacific Printed Electronics in Healthcare Market Forecast (USD Billion), by Sub-Segment 2, 2018-2029
      Figure 70: Asia Pacific Printed Electronics in Healthcare Market Value Share (%), By Segment 2, 2023 & 2029
      Figure 71: Asia Pacific Printed Electronics in Healthcare Market Forecast (USD Billion), by Sub-Segment 1, 2018-2029
      Figure 72: Asia Pacific Printed Electronics in Healthcare Market Forecast (USD Billion), by Sub-Segment 2, 2018-2029
      Figure 73: Asia Pacific Printed Electronics in Healthcare Market Forecast (USD Billion), by Sub-Segment 3, 2018-2029
      Figure 74: Asia Pacific Printed Electronics in Healthcare Market Forecast (USD Billion), by Others, 2018-2029
      Figure 75: Asia Pacific Printed Electronics in Healthcare Market Value Share (%), By Segment 3, 2023 & 2029
      Figure 76: Asia Pacific Printed Electronics in Healthcare Market Forecast (USD Billion), by Sub-Segment 1, 2018-2029
      Figure 77: Asia Pacific Printed Electronics in Healthcare Market Forecast (USD Billion), by Sub-Segment 2, 2018-2029
      Figure 78: Asia Pacific Printed Electronics in Healthcare Market Forecast (USD Billion), by Sub-Segment 3, 2018-2029
      Figure 79: Asia Pacific Printed Electronics in Healthcare Market Forecast (USD Billion), by Others, 2018-2029
      Figure 80: Asia Pacific Printed Electronics in Healthcare Market Forecast (USD Billion), by China, 2018-2029
      Figure 81: Asia Pacific Printed Electronics in Healthcare Market Forecast (USD Billion), by India, 2018-2029
      Figure 82: Asia Pacific Printed Electronics in Healthcare Market Forecast (USD Billion), by Japan, 2018-2029
      Figure 83: Asia Pacific Printed Electronics in Healthcare Market Forecast (USD Billion), by Australia, 2018-2029
      Figure 84: Asia Pacific Printed Electronics in Healthcare Market Forecast (USD Billion), by Southeast Asia, 2018-2029
      Figure 85: Asia Pacific Printed Electronics in Healthcare Market Forecast (USD Billion), by Rest of Asia Pacific, 2018-2029
      Figure 86: Middle East & Africa Printed Electronics in Healthcare Market Value Share (%), By Segment 1, 2023 & 2029
      Figure 87: Middle East & Africa Printed Electronics in Healthcare Market Forecast (USD Billion), by Sub-Segment 1, 2018-2029
      Figure 88: Middle East & Africa Printed Electronics in Healthcare Market Forecast (USD Billion), by Sub-Segment 2, 2018-2029
      Figure 89: Middle East & Africa Printed Electronics in Healthcare Market Value Share (%), By Segment 2, 2023 & 2029
      Figure 90: Middle East & Africa Printed Electronics in Healthcare Market Forecast (USD Billion), by Sub-Segment 1, 2018-2029
      Figure 91: Middle East & Africa Printed Electronics in Healthcare Market Forecast (USD Billion), by Sub-Segment 2, 2018-2029
      Figure 92: Middle East & Africa Printed Electronics in Healthcare Market Forecast (USD Billion), by Sub-Segment 3, 2018-2029
      Figure 93: Middle East & Africa Printed Electronics in Healthcare Market Forecast (USD Billion), by Others, 2018-2029
      Figure 94: Middle East & Africa Printed Electronics in Healthcare Market Value Share (%), By Segment 3, 2023 & 2029
      Figure 95: Middle East & Africa Printed Electronics in Healthcare Market Forecast (USD Billion), by Sub-Segment 1, 2018-2029
      Figure 96: Middle East & Africa Printed Electronics in Healthcare Market Forecast (USD Billion), by Sub-Segment 2, 2018-2029
      Figure 97: Middle East & Africa Printed Electronics in Healthcare Market Forecast (USD Billion), by Sub-Segment 3, 2018-2029
      Figure 98: Middle East & Africa Printed Electronics in Healthcare Market Forecast (USD Billion), by Others, 2018-2029
      Figure 99: Middle East & Africa Printed Electronics in Healthcare Market Forecast (USD Billion), by GCC, 2018-2029
      Figure 100: Middle East & Africa Printed Electronics in Healthcare Market Forecast (USD Billion), by South Africa, 2018-2029
      Figure 101: Middle East & Africa Printed Electronics in Healthcare Market Forecast (USD Billion), by Rest of Middle East & Africa, 2018-2029 
      List of Tables
      Table 1: Global Printed Electronics in Healthcare Market Revenue (USD Billion) Forecast, by Segment 1, 2018-2029
      Table 2: Global Printed Electronics in Healthcare Market Revenue (USD Billion) Forecast, by Segment 2, 2018-2029
      Table 3: Global Printed Electronics in Healthcare Market Revenue (USD Billion) Forecast, by Segment 3, 2018-2029
      Table 4: Global Printed Electronics in Healthcare Market Revenue (USD Billion) Forecast, by Region, 2018-2029
      Table 5: North America Printed Electronics in Healthcare Market Revenue (USD Billion) Forecast, by Segment 1, 2018-2029
      Table 6: North America Printed Electronics in Healthcare Market Revenue (USD Billion) Forecast, by Segment 2, 2018-2029
      Table 7: North America Printed Electronics in Healthcare Market Revenue (USD Billion) Forecast, by Segment 3, 2018-2029
      Table 8: North America Printed Electronics in Healthcare Market Revenue (USD Billion) Forecast, by Country, 2018-2029
      Table 9: Europe Printed Electronics in Healthcare Market Revenue (USD Billion) Forecast, by Segment 1, 2018-2029
      Table 10: Europe Printed Electronics in Healthcare Market Revenue (USD Billion) Forecast, by Segment 2, 2018-2029
      Table 11: Europe Printed Electronics in Healthcare Market Revenue (USD Billion) Forecast, by Segment 3, 2018-2029
      Table 12: Europe Printed Electronics in Healthcare Market Revenue (USD Billion) Forecast, by Country, 2018-2029
      Table 13: Latin America Printed Electronics in Healthcare Market Revenue (USD Billion) Forecast, by Segment 1, 2018-2029
      Table 14: Latin America Printed Electronics in Healthcare Market Revenue (USD Billion) Forecast, by Segment 2, 2018-2029
      Table 15: Latin America Printed Electronics in Healthcare Market Revenue (USD Billion) Forecast, by Segment 3, 2018-2029
      Table 16: Latin America Printed Electronics in Healthcare Market Revenue (USD Billion) Forecast, by Country, 2018-2029
      Table 17: Asia Pacific Printed Electronics in Healthcare Market Revenue (USD Billion) Forecast, by Segment 1, 2018-2029
      Table 18: Asia Pacific Printed Electronics in Healthcare Market Revenue (USD Billion) Forecast, by Segment 2, 2018-2029
      Table 19: Asia Pacific Printed Electronics in Healthcare Market Revenue (USD Billion) Forecast, by Segment 3, 2018-2029
      Table 20: Asia Pacific Printed Electronics in Healthcare Market Revenue (USD Billion) Forecast, by Country, 2018-2029
      Table 21: Middle East & Africa Printed Electronics in Healthcare Market Revenue (USD Billion) Forecast, by Segment 1, 2018-2029
      Table 22: Middle East & Africa Printed Electronics in Healthcare Market Revenue (USD Billion) Forecast, by Segment 2, 2018-2029
      Table 23: Middle East & Africa Printed Electronics in Healthcare Market Revenue (USD Billion) Forecast, by Segment 3, 2018-2029
      Table 24: Middle East & Africa Printed Electronics in Healthcare Market Revenue (USD Billion) Forecast, by Country, 2018-2029
      Research Process

      Data Library Research are conducted by industry experts who offer insight on industry structure, market segmentations technology assessment and competitive landscape (CL), and penetration, as well as on emerging trends. Their analysis is based on primary interviews (~ 80%) and secondary research (~ 20%) as well as years of professional expertise in their respective industries. Adding to this, by analysing historical trends and current market positions, our analysts predict where the market will be headed for the next five years. Furthermore, the varying trends of segment & categories geographically presented are also studied and the estimated based on the primary & secondary research.

      In this particular report from the supply side Data Library Research has conducted primary surveys (interviews) with the key level executives (VP, CEO’s, Marketing Director, Business Development Manager and SOFT) of the companies that active & prominent as well as the midsized organization

      FIGURE 1: DLR RESEARH PROCESS

      research-methodology1

      Primary Research

      Extensive primary research was conducted to gain a deeper insight of the market and industry performance. The analysis is based on both primary and secondary research as well as years of professional expertise in the respective industries.

      In addition to analysing current and historical trends, our analysts predict where the market is headed over the next five years.

      It varies by segment for these categories geographically presented in the list of market tables. Speaking about this particular report we have conducted primary surveys (interviews) with the key level executives (VP, CEO’s, Marketing Director, Business Development Manager and many more) of the major players active in the market.

      Secondary Research

      Secondary research was mainly used to collect and identify information useful for the extensive, technical, market-oriented, and Friend’s study of the Global Extra Neutral Alcohol. It was also used to obtain key information about major players, market classification and segmentation according to the industry trends, geographical markets, and developments related to the market and technology perspectives. For this study, analysts have gathered information from various credible sources, such as annual reports, sec filings, journals, white papers, SOFT presentations, and company web sites.

      Market Size Estimation

      Both, top-down and bottom-up approaches were used to estimate and validate the size of the Global market and to estimate the size of various other dependent submarkets in the overall Extra Neutral Alcohol. The key players in the market were identified through secondary research and their market contributions in the respective geographies were determined through primary and secondary research.

      Forecast Model

      research-methodology2

      Happy to Assist You

      If you have a question?

      info@datalibraryresearch.com

      IND : +91 955 279 0357

      Browse Related Reports