Radio Frequency Energy Harvesting Technology Market Overview and Analysis
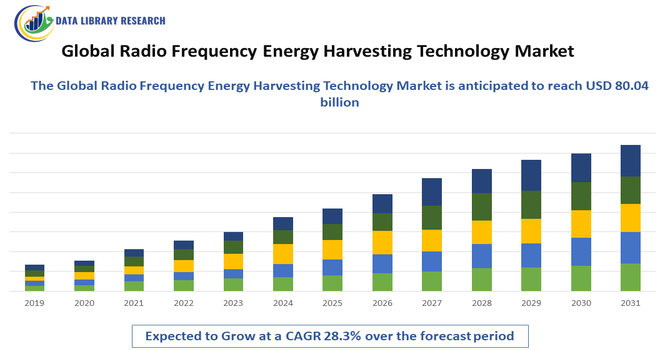
- The Radio Frequency (RF) Energy Harvesting Market, valued at USD 27.26 billion in 2025, is projected to reach USD 80.04 billion by 2032, growing at a 28.3% CAGR from 2025-2032.
Get Complete Analysis Of The Report - Download Updated Free Sample PDF
The Global Radio Frequency (RF) Energy Harvesting Technology Market refers to the industry focused on capturing ambient RF signals from sources like Wi-Fi, cellular networks, and broadcast towers, converting them into usable electrical energy. This technology powers low-energy devices, IoT sensors, and wearables, reducing reliance on batteries, lowering operational costs, and enabling sustainable, self-powered electronic solutions across industries.
Radio Frequency Energy Harvesting Technology Market Latest Trends
The RF energy harvesting technology market is witnessing rapid growth due to the rising demand for wireless, self-powered IoT devices, wearables, and remote sensors. Increasing integration of RF harvesting modules in smart homes, healthcare, industrial automation, and telecommunication systems is accelerating adoption. Technological advancements in energy conversion efficiency, miniaturized antennas, and low-power circuits enable reliable operation in diverse environments.
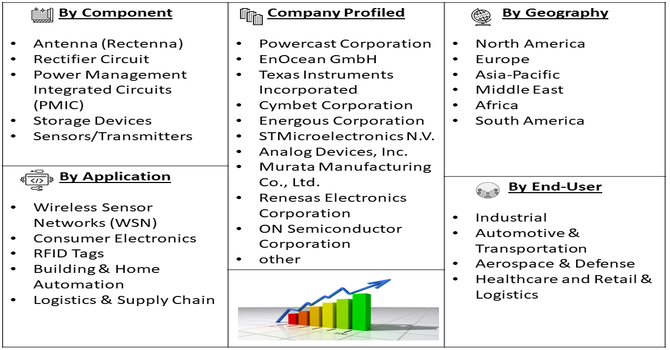
Segmentation: The Radio Frequency (RF) Energy Harvesting Technology Market is segmented by Component (Antenna (Rectenna), Rectifier Circuit, Power Management Integrated Circuits (PMIC), Storage Devices, and Sensors/Transmitters), Application (Wireless Sensor Networks (WSN), Consumer Electronics, RFID Tags, Building & Home Automation and Logistics & Supply Chain), End-User Industry (Industrial, Automotive & Transportation, Aerospace & Defense, Healthcare and Retail & Logistics), and Geography (North America, Europe, Asia-Pacific, Middle East and Africa, and South America). The report provides the value (in USD million) for the above segments.
For Detailed Market Segmentation - Get a Free Sample PDF
Market Drivers:
- Rising Adoption of IoT and Wearable Devices
The rapid growth of the Internet of Things (IoT) and wearable electronics is a key driver for the RF energy harvesting market. Devices such as smartwatches, fitness trackers, industrial sensors, and remote monitoring systems require low-power, continuous energy sources.
In December 2025, STMicroelectronics launched low-voltage, radiation-hardened rectifier diodes for LEO satellite power circuits, enhancing reliability in switched-mode power supplies and DC-DC converters. Their lightweight, flight-ready design supports efficient power management, demonstrating advanced energy solutions applicable to IoT and wearable devices. By enabling more reliable, low-power operation, this innovation drives adoption of self-powered electronics and strengthens growth and technological capabilities in the Global RF Energy Harvesting Technology Market.
- Government Initiatives and Focus on Sustainable Energy
Global emphasis on energy efficiency and sustainable solutions is driving growth in RF energy harvesting technology. Governments and regulatory bodies promote low-power, green technologies to reduce carbon emissions and electronic waste. RF harvesting supports these initiatives by powering sensors and IoT devices without relying on conventional batteries, lowering energy consumption and operational costs.
Incentives for smart infrastructure, renewable energy adoption, and green electronics further encourage deployment. The technology aligns with global sustainability goals, helping organizations meet environmental standards while fostering innovation in wireless power systems, thereby strengthening the market for RF energy harvesting solutions worldwide.
Market Restraints:
- Low Energy Conversion Efficiency
A major restraint for the RF energy harvesting market is the inherently low energy conversion efficiency. Ambient RF signals, such as those from Wi-Fi, cellular, or broadcast networks, often provide limited power, insufficient for high-consumption devices. Variability in signal strength, distance from transmitters, and environmental interference further reduce reliability. These limitations restrict adoption to low-power applications and hinder large-scale deployment. Additionally, designing circuits and antennas that can efficiently capture and convert weak RF signals remains technically challenging. Until technological advancements improve energy harvesting efficiency, the market growth may be constrained, limiting broader integration across industrial and consumer electronics.
Socioeconomic Impact on Radio Frequency Energy Harvesting Technology Market
RF energy harvesting technology offers significant socioeconomic benefits by enabling energy-efficient, self-sustaining electronic systems that reduce dependency on batteries and grid electricity. This decreases electronic waste, lowers operational costs, and improves sustainability in industrial, commercial, and residential applications. By powering IoT devices, healthcare sensors, and remote monitoring systems, RF harvesting enhances productivity, safety, and quality of life. Emerging economies benefit from low-maintenance, cost-effective energy solutions for smart infrastructure, agriculture, and telecommunication networks. The adoption of RF energy harvesting promotes green technology development, job creation in research, design, and manufacturing, and contributes to global efforts toward carbon reduction and sustainable development.
Segmental Analysis:
- Rectifier Circuit segment is expected to witness highest growth over the forecast period
The Rectifier Circuit segment is projected to witness the highest growth due to increasing demand for efficient power conversion in renewable energy systems. Rectifiers convert AC to DC power, supporting solar, wind, and hybrid power plants while enhancing grid stability and reliability. Rising deployment of power electronics in smart grids, energy storage systems, and distributed generation accelerates adoption. Technological advancements in high-efficiency, low-loss rectifiers reduce energy wastage and operational costs. Utilities and industrial players increasingly rely on rectifier circuits to optimize power quality and ensure consistent energy delivery, making this segment a key growth driver.
- Wireless Sensor Networks (WSN) segment is expected to witness highest growth over the forecast period
The Wireless Sensor Networks (WSN) segment is expected to experience significant growth as smart energy management becomes critical in renewable power stations. WSNs enable real-time monitoring, predictive maintenance, and efficient load management across solar, wind, and hybrid plants. By transmitting data wirelessly, these networks reduce infrastructure costs and enhance operational flexibility. Increasing adoption of IoT-based energy solutions, demand for remote monitoring, and integration with smart grids further drive market expansion. WSN technology improves reliability, reduces downtime, and supports decentralized energy management, making it essential for modern power stations and boosting the growth of new energy power station solutions.
- Automotive & Transportation segment is expected to witness highest growth over the forecast period
The Automotive & Transportation segment is projected to witness strong growth due to rising electric vehicle (EV) adoption and the integration of renewable energy solutions in transportation infrastructure. EV charging stations, hybrid systems, and energy storage solutions require advanced power electronics, rectifiers, and smart monitoring systems. Governments’ incentives, emissions regulations, and corporate sustainability goals accelerate deployment. Renewable-powered transportation solutions reduce operational costs and carbon emissions, promoting green mobility. Increasing investments in fleet electrification, smart highways, and public transport electrification contribute to higher demand for new energy power station solutions in this sector, driving market growth globally.
- North America region is expected to witness highest growth over the forecast period
North America is expected to witness the highest growth due to increasing adoption of renewable energy, supportive government policies, and technological innovation. The U.S. and Canada invest heavily in solar, wind, bioenergy, and energy storage solutions to meet sustainability targets and reduce carbon emissions. For instance, in August 2025, Nozomi Networks and Schneider Electric introduced the first embedded security sensor within SCADAPack 47xi Smart RTUs, enhancing visibility and threat detection at the control device level in industrial automation. By enabling secure, energy-efficient monitoring and analysis without disrupting operations, this innovation supports adoption of RF energy harvesting-powered IoT and OT devices, improving operational resilience, uptime, and cybersecurity, thereby boosting growth and technological advancement in the U.S. RF Energy Harvesting Technology Market.
Smart grid modernization, electrification of transportation, and industrial demand for reliable renewable power drive market expansion. Advanced energy storage, monitoring, and power conversion technologies accelerate deployment of new energy power stations. Rising private sector investment, regulatory incentives, and robust infrastructure development position North America as a leading and fast-growing market for new energy power station solutions.
| Report Matrics |
Details |
| Market Size Value |
USD 80.04 billion |
| Growth Rate |
CAGR of 28.3 % |
| Forecast |
2026-2033 |
| Historical data |
2021-2024 |
| Base Year |
2025 |
| Report Coverage |
Forecasted revenue, company rating, competitive environment, growth drivers, and trends |
| Segment Coverage |
Type, Application, End-User, Geography |
| Regional Scope |
North America, Europe, Asia Pacific, Middle East |
| Customized scope |
Free customization of reports (With 3 months Analysis Support ) |
| To Learn More About This Report |
Request a Free Sample Copy |
Radio Frequency Energy Harvesting Technology Market Competitive Landscape
The global RF energy harvesting market is competitive, with a mix of established semiconductor manufacturers, IoT solution providers, and innovative startups. Key players focus on enhancing energy conversion efficiency, miniaturization, and integration into diverse electronic platforms. Strategic partnerships, mergers, and acquisitions accelerate technological advancement and market penetration. Companies invest in R&D to develop novel antenna designs, rectifiers, and energy management circuits for low-power applications. Geographic expansion and collaboration with IoT, wearable, and wireless infrastructure sectors strengthen market presence. Innovation-driven differentiation and government incentives for green energy technologies further shape competition, driving continuous improvement and adoption across global markets.
The major players for above market are:
- Powercast Corporation
- EnOcean GmbH
- Texas Instruments Incorporated
- Cymbet Corporation
- Energous Corporation
- STMicroelectronics N.V.
- Analog Devices, Inc.
- Murata Manufacturing Co., Ltd.
- Renesas Electronics Corporation
- ON Semiconductor Corporation
- Cypress Semiconductor Corporation (Infineon)
- Microchip Technology Inc.
- Honeywell International Inc.
- Laird Connectivity
- Vishay Intertechnology, Inc.
- Toshiba Corporation
- Nippon Ceramic Co., Ltd.
- Antenova Ltd.
- e peas S.A.
- GreenPeak Technologies
Recent Development:
- In June 2025, Sony Semiconductor Solutions Corporation announced the IMX479 dToF SPAD depth sensor for automotive LiDAR, delivering high-resolution, high-speed performance. By enhancing precise distance measurement for ADAS and automated driving, the sensor supports energy-efficient, smart automotive systems. Its advanced technology drives integration of RF energy harvesting in automotive sensors, accelerating adoption of self-powered devices, and strengthening innovation and growth in the Global RF Energy Harvesting Technology Market.
- In March 2025, INFRGY LLC filed a second patent for its extended-range wireless energy harvesting system, developed with the University of Kashmir’s Institute of Technology. The innovation, enhancing RF-to-electricity conversion and transmission distance, strengthened technological capabilities in the market. By enabling higher output and broader application of RF energy harvesting, this development accelerated adoption across IoT, wearable, and industrial devices, boosting growth and competitiveness in the Global RF Energy Harvesting Technology Market.
Frequently Asked Questions (FAQ) :
Q1. What are the main growth-driving factors for this market?
The primary driver is the explosive growth of the Internet of Things (IoT) devices, which require persistent, maintenance-free power. RF harvesting eliminates the need for batteries in sensors, reducing upkeep costs significantly. Growing interest in passive wireless sensor networks, especially in industrial monitoring and smart city applications, also fuels expansion.
Q2. What are the main restraining factors for this market?
The chief constraint is the low power density of RF signals, meaning only milliwatts of power can be harvested, limiting its use to low-power electronics. Additionally, signal interference from other wireless technologies and regulatory restrictions on maximum RF transmission power levels can hinder performance and scalability.
Q3. Which segment is expected to witness high growth?
The Wireless Sensor Network (WSN) segment is expected to see the highest growth. As industries adopt pervasive monitoring and data collection, the demand for perpetually powered, battery-less sensors for building automation, logistics tracking, and structural health monitoring, which utilize RF harvesting, will surge.
Q4. Who are the top major players for this market?
Key market players include technology specialists focusing on energy management and wireless power, such as Powercast Corporation, known for its long-range wireless power solutions, and major semiconductor firms like STMicroelectronics and Analog Devices, which supply the specialized rectifier circuits and power management chips.
Q5. Which country is the largest player?
The United States (US) is considered the largest player. This dominance is driven by high investment in advanced wireless technologies, the presence of major technology and semiconductor companies, and substantial R&D activity focused on developing scalable RF harvesting solutions for both military and commercial IoT applications.
List of Figures
Figure 1: Global Radio Frequency Energy Harvesting Technology Market Revenue Breakdown (USD Billion, %) by Region, 2022 & 2029
Figure 2: Global Radio Frequency Energy Harvesting Technology Market Value Share (%), By Segment 1, 2022 & 2029
Figure 3: Global Radio Frequency Energy Harvesting Technology Market Forecast (USD Billion), by Sub-Segment 1, 2018-2029
Figure 4: Global Radio Frequency Energy Harvesting Technology Market Forecast (USD Billion), by Sub-Segment 2, 2018-2029
Figure 5: Global Radio Frequency Energy Harvesting Technology Market Value Share (%), By Segment 2, 2022 & 2029
Figure 6: Global Radio Frequency Energy Harvesting Technology Market Forecast (USD Billion), by Sub-Segment 1, 2018-2029
Figure 7: Global Radio Frequency Energy Harvesting Technology Market Forecast (USD Billion), by Sub-Segment 2, 2018-2029
Figure 8: Global Radio Frequency Energy Harvesting Technology Market Forecast (USD Billion), by Sub-Segment 3, 2018-2029
Figure 9: Global Radio Frequency Energy Harvesting Technology Market Forecast (USD Billion), by Others, 2018-2029
Figure 10: Global Radio Frequency Energy Harvesting Technology Market Value Share (%), By Segment 3, 2022 & 2029
Figure 11: Global Radio Frequency Energy Harvesting Technology Market Forecast (USD Billion), by Sub-Segment 1, 2018-2029
Figure 12: Global Radio Frequency Energy Harvesting Technology Market Forecast (USD Billion), by Sub-Segment 2, 2018-2029
Figure 13: Global Radio Frequency Energy Harvesting Technology Market Forecast (USD Billion), by Sub-Segment 3, 2018-2029
Figure 14: Global Radio Frequency Energy Harvesting Technology Market Forecast (USD Billion), by Others, 2018-2029
Figure 15: Global Radio Frequency Energy Harvesting Technology Market Value (USD Billion), by Region, 2022 & 2029
Figure 16: North America Radio Frequency Energy Harvesting Technology Market Value Share (%), By Segment 1, 2022 & 2029
Figure 17: North America Radio Frequency Energy Harvesting Technology Market Forecast (USD Billion), by Sub-Segment 1, 2018-2029
Figure 18: North America Radio Frequency Energy Harvesting Technology Market Forecast (USD Billion), by Sub-Segment 2, 2018-2029
Figure 19: North America Radio Frequency Energy Harvesting Technology Market Value Share (%), By Segment 2, 2022 & 2029
Figure 20: North America Radio Frequency Energy Harvesting Technology Market Forecast (USD Billion), by Sub-Segment 1, 2018-2029
Figure 21: North America Radio Frequency Energy Harvesting Technology Market Forecast (USD Billion), by Sub-Segment 2, 2018-2029
Figure 22: North America Radio Frequency Energy Harvesting Technology Market Forecast (USD Billion), by Sub-Segment 3, 2018-2029
Figure 23: North America Radio Frequency Energy Harvesting Technology Market Forecast (USD Billion), by Others, 2018-2029
Figure 24: North America Radio Frequency Energy Harvesting Technology Market Value Share (%), By Segment 3, 2022 & 2029
Figure 25: North America Radio Frequency Energy Harvesting Technology Market Forecast (USD Billion), by Sub-Segment 1, 2018-2029
Figure 26: North America Radio Frequency Energy Harvesting Technology Market Forecast (USD Billion), by Sub-Segment 2, 2018-2029
Figure 27: North America Radio Frequency Energy Harvesting Technology Market Forecast (USD Billion), by Sub-Segment 3, 2018-2029
Figure 28: North America Radio Frequency Energy Harvesting Technology Market Forecast (USD Billion), by Others, 2018-2029
Figure 29: North America Radio Frequency Energy Harvesting Technology Market Forecast (USD Billion), by U.S., 2018-2029
Figure 30: North America Radio Frequency Energy Harvesting Technology Market Forecast (USD Billion), by Canada, 2018-2029
Figure 31: Latin America Radio Frequency Energy Harvesting Technology Market Value Share (%), By Segment 1, 2022 & 2029
Figure 32: Latin America Radio Frequency Energy Harvesting Technology Market Forecast (USD Billion), by Sub-Segment 1, 2018-2029
Figure 33: Latin America Radio Frequency Energy Harvesting Technology Market Forecast (USD Billion), by Sub-Segment 2, 2018-2029
Figure 34: Latin America Radio Frequency Energy Harvesting Technology Market Value Share (%), By Segment 2, 2022 & 2029
Figure 35: Latin America Radio Frequency Energy Harvesting Technology Market Forecast (USD Billion), by Sub-Segment 1, 2018-2029
Figure 36: Latin America Radio Frequency Energy Harvesting Technology Market Forecast (USD Billion), by Sub-Segment 2, 2018-2029
Figure 37: Latin America Radio Frequency Energy Harvesting Technology Market Forecast (USD Billion), by Sub-Segment 3, 2018-2029
Figure 38: Latin America Radio Frequency Energy Harvesting Technology Market Forecast (USD Billion), by Others, 2018-2029
Figure 39: Latin America Radio Frequency Energy Harvesting Technology Market Value Share (%), By Segment 3, 2022 & 2029
Figure 40: Latin America Radio Frequency Energy Harvesting Technology Market Forecast (USD Billion), by Sub-Segment 1, 2018-2029
Figure 41: Latin America Radio Frequency Energy Harvesting Technology Market Forecast (USD Billion), by Sub-Segment 2, 2018-2029
Figure 42: Latin America Radio Frequency Energy Harvesting Technology Market Forecast (USD Billion), by Sub-Segment 3, 2018-2029
Figure 43: Latin America Radio Frequency Energy Harvesting Technology Market Forecast (USD Billion), by Others, 2018-2029
Figure 44: Latin America Radio Frequency Energy Harvesting Technology Market Forecast (USD Billion), by Brazil, 2018-2029
Figure 45: Latin America Radio Frequency Energy Harvesting Technology Market Forecast (USD Billion), by Mexico, 2018-2029
Figure 46: Latin America Radio Frequency Energy Harvesting Technology Market Forecast (USD Billion), by Rest of Latin America, 2018-2029
Figure 47: Europe Radio Frequency Energy Harvesting Technology Market Value Share (%), By Segment 1, 2022 & 2029
Figure 48: Europe Radio Frequency Energy Harvesting Technology Market Forecast (USD Billion), by Sub-Segment 1, 2018-2029
Figure 49: Europe Radio Frequency Energy Harvesting Technology Market Forecast (USD Billion), by Sub-Segment 2, 2018-2029
Figure 50: Europe Radio Frequency Energy Harvesting Technology Market Value Share (%), By Segment 2, 2022 & 2029
Figure 51: Europe Radio Frequency Energy Harvesting Technology Market Forecast (USD Billion), by Sub-Segment 1, 2018-2029
Figure 52: Europe Radio Frequency Energy Harvesting Technology Market Forecast (USD Billion), by Sub-Segment 2, 2018-2029
Figure 53: Europe Radio Frequency Energy Harvesting Technology Market Forecast (USD Billion), by Sub-Segment 3, 2018-2029
Figure 54: Europe Radio Frequency Energy Harvesting Technology Market Forecast (USD Billion), by Others, 2018-2029
Figure 55: Europe Radio Frequency Energy Harvesting Technology Market Value Share (%), By Segment 3, 2022 & 2029
Figure 56: Europe Radio Frequency Energy Harvesting Technology Market Forecast (USD Billion), by Sub-Segment 1, 2018-2029
Figure 57: Europe Radio Frequency Energy Harvesting Technology Market Forecast (USD Billion), by Sub-Segment 2, 2018-2029
Figure 58: Europe Radio Frequency Energy Harvesting Technology Market Forecast (USD Billion), by Sub-Segment 3, 2018-2029
Figure 59: Europe Radio Frequency Energy Harvesting Technology Market Forecast (USD Billion), by Others, 2018-2029
Figure 60: Europe Radio Frequency Energy Harvesting Technology Market Forecast (USD Billion), by U.K., 2018-2029
Figure 61: Europe Radio Frequency Energy Harvesting Technology Market Forecast (USD Billion), by Germany, 2018-2029
Figure 62: Europe Radio Frequency Energy Harvesting Technology Market Forecast (USD Billion), by France, 2018-2029
Figure 63: Europe Radio Frequency Energy Harvesting Technology Market Forecast (USD Billion), by Italy, 2018-2029
Figure 64: Europe Radio Frequency Energy Harvesting Technology Market Forecast (USD Billion), by Spain, 2018-2029
Figure 65: Europe Radio Frequency Energy Harvesting Technology Market Forecast (USD Billion), by Russia, 2018-2029
Figure 66: Europe Radio Frequency Energy Harvesting Technology Market Forecast (USD Billion), by Rest of Europe, 2018-2029
Figure 67: Asia Pacific Radio Frequency Energy Harvesting Technology Market Value Share (%), By Segment 1, 2022 & 2029
Figure 68: Asia Pacific Radio Frequency Energy Harvesting Technology Market Forecast (USD Billion), by Sub-Segment 1, 2018-2029
Figure 69: Asia Pacific Radio Frequency Energy Harvesting Technology Market Forecast (USD Billion), by Sub-Segment 2, 2018-2029
Figure 70: Asia Pacific Radio Frequency Energy Harvesting Technology Market Value Share (%), By Segment 2, 2022 & 2029
Figure 71: Asia Pacific Radio Frequency Energy Harvesting Technology Market Forecast (USD Billion), by Sub-Segment 1, 2018-2029
Figure 72: Asia Pacific Radio Frequency Energy Harvesting Technology Market Forecast (USD Billion), by Sub-Segment 2, 2018-2029
Figure 73: Asia Pacific Radio Frequency Energy Harvesting Technology Market Forecast (USD Billion), by Sub-Segment 3, 2018-2029
Figure 74: Asia Pacific Radio Frequency Energy Harvesting Technology Market Forecast (USD Billion), by Others, 2018-2029
Figure 75: Asia Pacific Radio Frequency Energy Harvesting Technology Market Value Share (%), By Segment 3, 2022 & 2029
Figure 76: Asia Pacific Radio Frequency Energy Harvesting Technology Market Forecast (USD Billion), by Sub-Segment 1, 2018-2029
Figure 77: Asia Pacific Radio Frequency Energy Harvesting Technology Market Forecast (USD Billion), by Sub-Segment 2, 2018-2029
Figure 78: Asia Pacific Radio Frequency Energy Harvesting Technology Market Forecast (USD Billion), by Sub-Segment 3, 2018-2029
Figure 79: Asia Pacific Radio Frequency Energy Harvesting Technology Market Forecast (USD Billion), by Others, 2018-2029
Figure 80: Asia Pacific Radio Frequency Energy Harvesting Technology Market Forecast (USD Billion), by China, 2018-2029
Figure 81: Asia Pacific Radio Frequency Energy Harvesting Technology Market Forecast (USD Billion), by India, 2018-2029
Figure 82: Asia Pacific Radio Frequency Energy Harvesting Technology Market Forecast (USD Billion), by Japan, 2018-2029
Figure 83: Asia Pacific Radio Frequency Energy Harvesting Technology Market Forecast (USD Billion), by Australia, 2018-2029
Figure 84: Asia Pacific Radio Frequency Energy Harvesting Technology Market Forecast (USD Billion), by Southeast Asia, 2018-2029
Figure 85: Asia Pacific Radio Frequency Energy Harvesting Technology Market Forecast (USD Billion), by Rest of Asia Pacific, 2018-2029
Figure 86: Middle East & Africa Radio Frequency Energy Harvesting Technology Market Value Share (%), By Segment 1, 2022 & 2029
Figure 87: Middle East & Africa Radio Frequency Energy Harvesting Technology Market Forecast (USD Billion), by Sub-Segment 1, 2018-2029
Figure 88: Middle East & Africa Radio Frequency Energy Harvesting Technology Market Forecast (USD Billion), by Sub-Segment 2, 2018-2029
Figure 89: Middle East & Africa Radio Frequency Energy Harvesting Technology Market Value Share (%), By Segment 2, 2022 & 2029
Figure 90: Middle East & Africa Radio Frequency Energy Harvesting Technology Market Forecast (USD Billion), by Sub-Segment 1, 2018-2029
Figure 91: Middle East & Africa Radio Frequency Energy Harvesting Technology Market Forecast (USD Billion), by Sub-Segment 2, 2018-2029
Figure 92: Middle East & Africa Radio Frequency Energy Harvesting Technology Market Forecast (USD Billion), by Sub-Segment 3, 2018-2029
Figure 93: Middle East & Africa Radio Frequency Energy Harvesting Technology Market Forecast (USD Billion), by Others, 2018-2029
Figure 94: Middle East & Africa Radio Frequency Energy Harvesting Technology Market Value Share (%), By Segment 3, 2022 & 2029
Figure 95: Middle East & Africa Radio Frequency Energy Harvesting Technology Market Forecast (USD Billion), by Sub-Segment 1, 2018-2029
Figure 96: Middle East & Africa Radio Frequency Energy Harvesting Technology Market Forecast (USD Billion), by Sub-Segment 2, 2018-2029
Figure 97: Middle East & Africa Radio Frequency Energy Harvesting Technology Market Forecast (USD Billion), by Sub-Segment 3, 2018-2029
Figure 98: Middle East & Africa Radio Frequency Energy Harvesting Technology Market Forecast (USD Billion), by Others, 2018-2029
Figure 99: Middle East & Africa Radio Frequency Energy Harvesting Technology Market Forecast (USD Billion), by GCC, 2018-2029
Figure 100: Middle East & Africa Radio Frequency Energy Harvesting Technology Market Forecast (USD Billion), by South Africa, 2018-2029
Figure 101: Middle East & Africa Radio Frequency Energy Harvesting Technology Market Forecast (USD Billion), by Rest of Middle East & Africa, 2018-2029
List of Tables
Table 1: Global Radio Frequency Energy Harvesting Technology Market Revenue (USD Billion) Forecast, by Segment 1, 2018-2029
Table 2: Global Radio Frequency Energy Harvesting Technology Market Revenue (USD Billion) Forecast, by Segment 2, 2018-2029
Table 3: Global Radio Frequency Energy Harvesting Technology Market Revenue (USD Billion) Forecast, by Segment 3, 2018-2029
Table 4: Global Radio Frequency Energy Harvesting Technology Market Revenue (USD Billion) Forecast, by Region, 2018-2029
Table 5: North America Radio Frequency Energy Harvesting Technology Market Revenue (USD Billion) Forecast, by Segment 1, 2018-2029
Table 6: North America Radio Frequency Energy Harvesting Technology Market Revenue (USD Billion) Forecast, by Segment 2, 2018-2029
Table 7: North America Radio Frequency Energy Harvesting Technology Market Revenue (USD Billion) Forecast, by Segment 3, 2018-2029
Table 8: North America Radio Frequency Energy Harvesting Technology Market Revenue (USD Billion) Forecast, by Country, 2018-2029
Table 9: Europe Radio Frequency Energy Harvesting Technology Market Revenue (USD Billion) Forecast, by Segment 1, 2018-2029
Table 10: Europe Radio Frequency Energy Harvesting Technology Market Revenue (USD Billion) Forecast, by Segment 2, 2018-2029
Table 11: Europe Radio Frequency Energy Harvesting Technology Market Revenue (USD Billion) Forecast, by Segment 3, 2018-2029
Table 12: Europe Radio Frequency Energy Harvesting Technology Market Revenue (USD Billion) Forecast, by Country, 2018-2029
Table 13: Latin America Radio Frequency Energy Harvesting Technology Market Revenue (USD Billion) Forecast, by Segment 1, 2018-2029
Table 14: Latin America Radio Frequency Energy Harvesting Technology Market Revenue (USD Billion) Forecast, by Segment 2, 2018-2029
Table 15: Latin America Radio Frequency Energy Harvesting Technology Market Revenue (USD Billion) Forecast, by Segment 3, 2018-2029
Table 16: Latin America Radio Frequency Energy Harvesting Technology Market Revenue (USD Billion) Forecast, by Country, 2018-2029
Table 17: Asia Pacific Radio Frequency Energy Harvesting Technology Market Revenue (USD Billion) Forecast, by Segment 1, 2018-2029
Table 18: Asia Pacific Radio Frequency Energy Harvesting Technology Market Revenue (USD Billion) Forecast, by Segment 2, 2018-2029
Table 19: Asia Pacific Radio Frequency Energy Harvesting Technology Market Revenue (USD Billion) Forecast, by Segment 3, 2018-2029
Table 20: Asia Pacific Radio Frequency Energy Harvesting Technology Market Revenue (USD Billion) Forecast, by Country, 2018-2029
Table 21: Middle East & Africa Radio Frequency Energy Harvesting Technology Market Revenue (USD Billion) Forecast, by Segment 1, 2018-2029
Table 22: Middle East & Africa Radio Frequency Energy Harvesting Technology Market Revenue (USD Billion) Forecast, by Segment 2, 2018-2029
Table 23: Middle East & Africa Radio Frequency Energy Harvesting Technology Market Revenue (USD Billion) Forecast, by Segment 3, 2018-2029
Table 24: Middle East & Africa Radio Frequency Energy Harvesting Technology Market Revenue (USD Billion) Forecast, by Country, 2018-2029
Research Process
Data Library Research are conducted by industry experts who offer insight on
industry structure, market segmentations technology assessment and competitive landscape (CL), and penetration, as well as on emerging trends. Their analysis is based on primary interviews (~ 80%) and secondary research (~ 20%) as well as years of professional expertise in their respective industries. Adding to this, by analysing historical trends and current market positions, our analysts predict where the market will be headed for the next five years. Furthermore, the varying trends of segment & categories geographically presented are also studied and the estimated based on the primary & secondary research.
In this particular report from the supply side Data Library Research has conducted primary surveys (interviews) with the key level executives (VP, CEO’s, Marketing Director, Business Development Manager
and SOFT) of the companies that active & prominent as well as the midsized organization
FIGURE 1: DLR RESEARH PROCESS
![research-methodology1]()
Primary Research
Extensive primary research was conducted to gain a deeper insight of the market and industry performance. The analysis is based on both primary and secondary research as well as years of professional expertise in the respective industries.
In addition to analysing current and historical trends, our analysts predict where the market is headed over the next five years.
It varies by segment for these categories geographically presented in the list of market tables. Speaking about this particular report we have conducted primary surveys (interviews) with the key level executives (VP, CEO’s, Marketing Director, Business Development Manager and many more) of the major players active in the market.
Secondary Research
Secondary research was mainly used to collect and identify information useful for the extensive, technical, market-oriented, and Friend’s study of the Global Extra Neutral Alcohol. It was also used to obtain key information about major players, market classification and segmentation according to the industry trends, geographical markets, and developments related to the market and technology perspectives. For this study, analysts have gathered information from various credible sources, such as annual reports, sec filings, journals, white papers, SOFT presentations, and company web sites.
Market Size Estimation
Both, top-down and bottom-up approaches were used to estimate and validate the size of the Global market and to estimate the size of various other dependent submarkets in the overall Extra Neutral Alcohol. The key players in the market were identified through secondary research and their market contributions in the respective geographies were determined through primary and secondary research.
Forecast Model
![research-methodology2]()