Get Complete Analysis Of The Report - Download Updated Free Sample PDF
The global recombinant parvovirus antigens market focuses on the development, production, and commercialization of recombinant antigens used in diagnostic assays and vaccines for parvovirus infections. Growth is driven by rising prevalence of parvovirus in humans and animals, technological advancements, and increasing demand for accurate, rapid, and cost-effective diagnostic solutions.
The Global Recombinant Parvovirus Antigens Market is experiencing significant growth, driven by multiple factors across human and veterinary healthcare. The rising incidence of parvovirus infections, such as canine parvovirus and other human parvovirus strains, has created strong demand for accurate and rapid diagnostic tools. Advancements in recombinant DNA technology have enabled the development of highly sensitive and specific recombinant antigens, improving the reliability and efficiency of diagnostic assays. Additionally, increasing healthcare expenditure worldwide supports greater adoption of advanced diagnostic solutions, while government initiatives and research funding are accelerating innovation in parvovirus detection and treatment. Collectively, these factors are driving robust market expansion, positioning the recombinant parvovirus antigens market for continued growth over the forecast period.
The Global Recombinant Parvovirus Antigens Market is experiencing several notable trends that are shaping its evolution. One of the key developments is the increasing demand for point-of-care diagnostic tests, which offer rapid and accessible detection of parvovirus infections. These tests are particularly valuable in both human and veterinary settings, enabling timely intervention. Additionally, there is a growing integration of recombinant parvovirus antigens into multiplex assays, allowing for the simultaneous detection of multiple pathogens, thereby enhancing diagnostic efficiency. The adoption of automation and advanced data analytics in diagnostic laboratories is also on the rise, streamlining workflows and improving accuracy. Furthermore, the market is witnessing a shift towards the development of recombinant antigens with higher specificity and stability, addressing the need for more reliable and durable diagnostic reagents. Collectively, these trends are driving innovation and expanding the applications of recombinant parvovirus antigens in diagnostics.
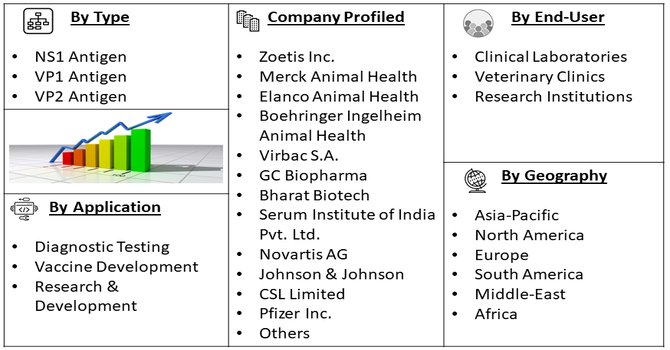
Segmentation: Global Recombinant Parvovirus Antigens Market is segmented By Antigen Type (NS1 Antigen, VP1 Antigen, VP2 Antigen), Application (Diagnostic Testing, Vaccine Development, Research & Development), End-User (Clinical Laboratories, Veterinary Clinics, Research Institutions), and Geography (North America, Europe, Asia-Pacific, Middle East and Africa, and South America). The report provides the value (in USD million) for the above segments.
For Detailed Market Segmentation - Get a Free Sample PDF
Market Drivers:
The increasing occurrence of parvovirus infections, particularly canine parvovirus in pets and human parvovirus B19, is a major factor driving market growth. These infections can lead to severe health complications if not detected and managed early. As awareness about the importance of timely diagnosis rises among pet owners, veterinarians, and healthcare providers, there is a growing demand for reliable diagnostic tools. Recombinant parvovirus antigens enable accurate and rapid detection of infections, facilitating early intervention and improving patient and animal health outcomes, thereby significantly boosting their adoption in clinical, veterinary, and research settings.
In January 2025, a study published in an article titled, “Infection rate of canine parvovirus in dogs presented at private veterinary clinics in Baghdad city” reported that 127 dogs tested positive for canine parvovirus (CPV) using rapid tests, showing an overall infection rate of 14.69%. Puppies under six and three months showed higher rates of 44.09% and 41.73%, respectively, with male dogs and Terriers most affected. Fever and other CPV-related clinical signs were common. Infection occurred in 71.65% of vaccinated dogs and 28.35% of unvaccinated dogs. Post-treatment, 87.4% recovered while 12.6% died. This rising prevalence of CPV underscored the need for effective diagnostic and preventive solutions, driving growth in the global recombinant parvovirus antigens market.
Technological innovations in recombinant DNA and protein expression systems have significantly enhanced the development of recombinant parvovirus antigens. These advancements allow for the production of highly specific, stable, and pure antigens, which improve the accuracy, sensitivity, and reliability of diagnostic assays. Additionally, such technologies facilitate vaccine development and support research into novel therapeutic approaches for parvovirus infections. As a result, these innovations are driving greater adoption of recombinant antigens in clinical diagnostics, veterinary applications, and research, contributing to the overall growth of the market.
In September 2025, A study published by Vet. Res. Commu., reported a novel epitope-based CPV vaccine, VP2D, developed by expressing key VP2 antigenic fragments via bacterial display and linking them into a chimeric protein. Animal experiments showed VP2D elicited stronger humoral and cellular immune responses than conventional VP2 and commercial vaccines, with higher antibody titers, increased CD4⁺ T and F4/80⁺ cells, and elevated inflammatory cytokines. This demonstrated the potential of recombinant DNA technology to create safer, more effective, and targeted vaccines.
Market Restraints:
High production costs associated with recombinant antigen development and purification limit accessibility, particularly for small veterinary clinics and research labs in emerging markets. Additionally, the complexity of manufacturing processes and the need for specialized equipment and skilled personnel pose challenges for widespread adoption. Regulatory hurdles for approval of diagnostic kits and vaccines in different regions can delay market entry and commercialization. Furthermore, limited awareness among end-users, particularly in developing countries, and competition from traditional diagnostic methods may slow the adoption of recombinant antigen-based solutions. These factors collectively restrain the overall market expansion.
The Global Recombinant Parvovirus Antigens Market exerts significant socio-economic impact by enhancing animal health, particularly in canine and porcine populations, which directly influences livestock productivity and the companion animal industry. Effective prevention and rapid diagnostics reduce disease-related mortality and treatment costs, safeguarding the livelihoods of pet owners, breeders, and farmers. Moreover, the market drives employment and revenue growth in biotechnology, veterinary services, and pharmaceutical manufacturing sectors. Increased adoption of recombinant antigen technologies also reduces public health risks associated with zoonotic infections. Investments in research, innovation, and veterinary infrastructure stimulate economic activity, while improved animal welfare enhances social well-being. Collectively, these factors demonstrate the market’s crucial role in both economic development and societal health outcomes globally.
Segmental Analysis:
The VP2 antigen segment is expected to witness the highest growth among antigen types. VP2 antigens are widely used in diagnostic assays and vaccine development due to their strong immunogenicity and ability to elicit a protective immune response. The increasing prevalence of parvovirus infections, particularly canine parvovirus, drives demand for VP2-based recombinant antigens, as they provide accurate and reliable detection. Technological advancements in recombinant DNA technology have further improved the specificity, stability, and scalability of VP2 antigen production, making this segment a key growth driver in the market.
The diagnostic testing segment dominates the application category and is projected to grow significantly. Recombinant parvovirus antigens are critical in rapid and accurate detection of parvovirus infections in both humans and animals. Early diagnosis enables timely intervention, reducing morbidity and mortality, particularly in veterinary populations. Rising awareness among healthcare providers and veterinarians about the benefits of precise diagnostics is accelerating adoption in clinical laboratories and veterinary clinics.
Veterinary clinics represent a key end-user segment driving market growth. With the increasing incidence of parvovirus infections in pets, clinics require reliable, rapid diagnostic tools to ensure effective disease management. The adoption of recombinant antigens in veterinary diagnostics allows for accurate identification of infections and supports preventive measures like vaccination, fueling the demand for these products.
The North America segment of the Global Recombinant Parvovirus Antigens Market is expected to witness the highest growth over the forecast period. This is primarily driven by the region’s advanced healthcare infrastructure, well-established veterinary care systems, and high adoption of diagnostic technologies. Increasing prevalence of parvovirus infections in pets, especially canine populations, has created strong demand for accurate and rapid diagnostic tools, while government initiatives and funding support research and development in recombinant antigen technology.
Additionally, the presence of leading market players, ongoing clinical trials, and rising awareness among veterinarians and healthcare providers about early detection and preventive measures are further boosting the adoption of recombinant parvovirus antigens in North America. These factors collectively position the region as a dominant and rapidly growing market for recombinant parvovirus antigen products.
Moreover, the North American market benefits from increasing pet ownership and the growing trend of pet humanization, which drives demand for advanced veterinary care and effective immunization strategies. Technological innovations, including next-generation recombinant vaccines and multiplex diagnostic platforms, are enhancing the accuracy and efficiency of parvovirus detection. Strategic collaborations between biotech companies, veterinary clinics, and research institutions are accelerating product development and commercialization. Together, these factors are expected to sustain robust market expansion, reinforce North America’s leadership in the recombinant parvovirus antigens sector, and create opportunities for new entrants and established players alike.
| Report Matrics | Details |
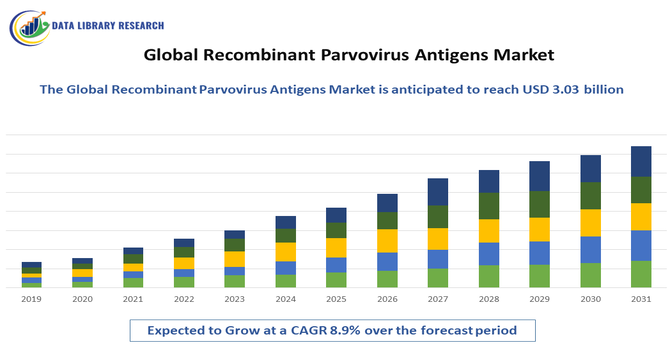
| Market Size Value | USD 3.03 billion |
| Growth Rate | CAGR of 8.9% |
| Forecast | 2026-2033 |
| Historical data | 2021-2024 |
| Base Year | 2025 |
| Report Coverage | Forecasted revenue, company rating, competitive environment, growth drivers, and trends |
| Segment Coverage | Type, Application, End-User, Geography |
| Regional Scope | North America, Europe, Asia Pacific, Middle East |
| Customized scope | Free customization of reports (With 3 months Analysis Support ) |
| To Learn More About This Report | Request a Free Sample Copy |
The global recombinant parvovirus antigens market is characterized by a competitive landscape comprising established pharmaceutical companies, biotechnology firms, and emerging players. Key industry participants are actively engaged in the development, manufacturing, and commercialization of recombinant parvovirus antigens to address the rising prevalence of parvovirus infections in both humans and animals. These companies are investing in research and development to enhance the efficacy and safety profiles of their products. Strategic collaborations, partnerships, and acquisitions are common strategies employed to expand product portfolios and market reach. The market's growth is further supported by increasing demand for advanced diagnostic tools and vaccines, coupled with supportive regulatory frameworks in various regions. As the market evolves, companies are focusing on innovation, quality control, and cost-effectiveness to maintain a competitive edge.
The 20 major players for above market are:
Recent Development:
Q1. What the main growth driving factors for this market?
The primary growth drivers are the rising incidence and prevalence of parvovirus infections in both animal (veterinary) and human populations. This fuels a higher demand for accurate and rapid diagnostic tools. Furthermore, advancements in recombinant DNA technology are key, enabling the development of more sensitive, specific, and cost-effective antigens. Increased global healthcare spending and a growing focus on early, accurate disease diagnosis and surveillance also contribute significantly to market expansion.
Q2. What are the main restraining factors for this market?
Key restraining factors include the high cost associated with developing and manufacturing high-quality recombinant antigens, which can limit market access, especially in developing regions. Another significant challenge is the stringent regulatory landscape for diagnostic products, which can prolong the time-to-market for new innovations. Competition from established traditional diagnostic methods that use inactivated viruses, along with the potential for cross-reactivity with other viruses, also restricts growth.
Q3. Which segment is expected to witness high growth?
The market segment focused on veterinary applications, particularly related to canine and porcine parvoviruses, is poised for high growth. This surge is driven by increasing global pet ownership, higher veterinary expenditure, and the significant economic impact of parvovirus outbreaks in livestock like swine. Geographically, the Asia-Pacific region is projected to be the fastest-growing market, propelled by rapidly improving healthcare infrastructure and increasing animal health awareness.
Q4. Who are the top major players for this market?
The recombinant parvovirus antigens market is a component within the broader diagnostics and vaccines industry, which is highly competitive. Major players in this space are large multinational pharmaceutical and biotechnology companies with extensive portfolios in animal and human health. While specific pure-play antigen market data varies, key global players include firms like Zoetis Inc., Merck & Co., Inc. (MSD Animal Health), Boehringer Ingelheim International GmbH, and Creative Diagnostics, who are active in the recombinant vaccine and antigen research, production, and distribution.
Q5. Which country is the largest player?
The United States, within the North American region, is generally considered the largest market player, holding the dominant revenue share. This is attributed to its robust healthcare and advanced veterinary infrastructure, significant investments in biotechnology research and development, and high diagnostic testing rates. The presence of numerous global pharmaceutical and biotech corporate headquarters in the U.S. also solidifies its leadership in the development and commercialization of new recombinant antigen products.
Data Library Research are conducted by industry experts who offer insight on industry structure, market segmentations technology assessment and competitive landscape (CL), and penetration, as well as on emerging trends. Their analysis is based on primary interviews (~ 80%) and secondary research (~ 20%) as well as years of professional expertise in their respective industries. Adding to this, by analysing historical trends and current market positions, our analysts predict where the market will be headed for the next five years. Furthermore, the varying trends of segment & categories geographically presented are also studied and the estimated based on the primary & secondary research.
In this particular report from the supply side Data Library Research has conducted primary surveys (interviews) with the key level executives (VP, CEO’s, Marketing Director, Business Development Manager and SOFT) of the companies that active & prominent as well as the midsized organization
FIGURE 1: DLR RESEARH PROCESS
Extensive primary research was conducted to gain a deeper insight of the market and industry performance. The analysis is based on both primary and secondary research as well as years of professional expertise in the respective industries.
In addition to analysing current and historical trends, our analysts predict where the market is headed over the next five years.
It varies by segment for these categories geographically presented in the list of market tables. Speaking about this particular report we have conducted primary surveys (interviews) with the key level executives (VP, CEO’s, Marketing Director, Business Development Manager and many more) of the major players active in the market.
Secondary ResearchSecondary research was mainly used to collect and identify information useful for the extensive, technical, market-oriented, and Friend’s study of the Global Extra Neutral Alcohol. It was also used to obtain key information about major players, market classification and segmentation according to the industry trends, geographical markets, and developments related to the market and technology perspectives. For this study, analysts have gathered information from various credible sources, such as annual reports, sec filings, journals, white papers, SOFT presentations, and company web sites.
Market Size EstimationBoth, top-down and bottom-up approaches were used to estimate and validate the size of the Global market and to estimate the size of various other dependent submarkets in the overall Extra Neutral Alcohol. The key players in the market were identified through secondary research and their market contributions in the respective geographies were determined through primary and secondary research.
Forecast Model