Smart Cockpit Domain Chip Market Overview and Analysis:
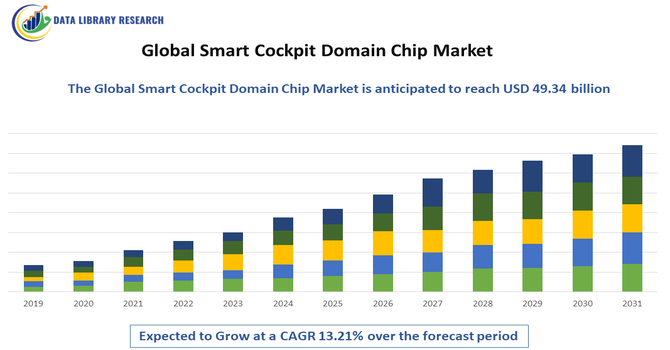
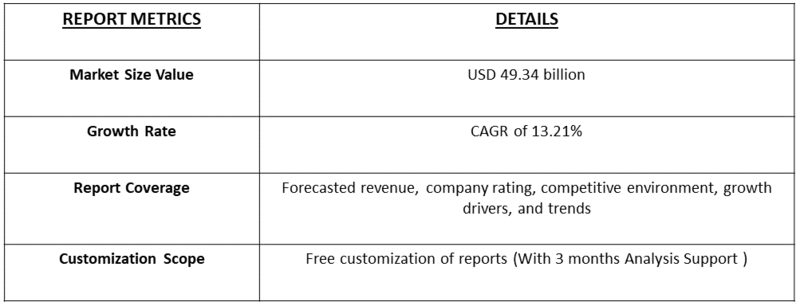
- The Global Smart Cockpit Domain Chip Market was valued at USD 26.61 billion in 2025 and is projected to reach nearly USD 49.34 billion by 2032, growing at a 13.21% from 2025 to 2032.
Get Complete Analysis Of The Report - Download Updated Free Sample PDF
The Global Smart Cockpit Domain Chip Market focuses on specialized semiconductors designed to integrate and manage in-vehicle infotainment, connectivity, driver-assistance, and digital instrument systems. Rising demand for connected, autonomous, and intelligent vehicles drove adoption, enabling seamless data processing, enhanced user experience, and real-time control across advanced automotive electronic architectures worldwide.
The growth of the Global Smart Cockpit Domain Chip Market was driven by increasing adoption of connected and autonomous vehicles, rising consumer demand for advanced infotainment and digital instrument systems, and the integration of AI and IoT technologies in cars. Additionally, regulatory emphasis on safety and vehicle telematics, along with advancements in high-performance, low-power semiconductor architectures, accelerated the development and deployment of smart cockpit chips, enabling real-time data processing, enhanced user experiences, and seamless integration of multiple automotive electronic systems, thereby significantly boosting market expansion across passenger and commercial vehicle segments globally.
Smart Cockpit Domain Chip Market Latest Trends
The global smart cockpit domain chip market has experienced rapid technological evolution, driven by increasing vehicle electrification, autonomous driving development, and consumer demand for connected experiences. Trends include the integration of AI-driven voice assistants, augmented reality dashboards, and multi-display infotainment systems. OEMs increasingly adopt centralized cockpit domain controllers to consolidate multiple electronic functions, reducing wiring complexity and improving efficiency.
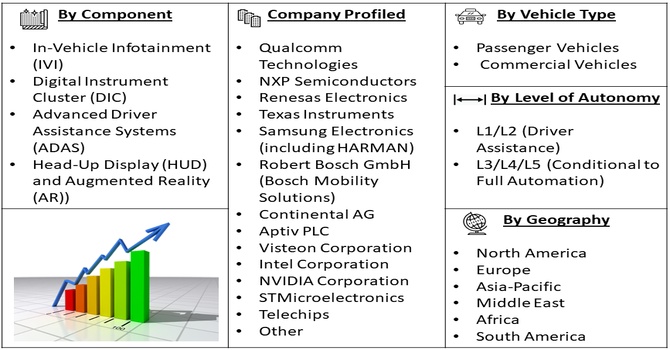
Segmentation: The Smart Cockpit Domain Chip market is segmented by Component (In-Vehicle Infotainment (IVI), Digital Instrument Cluster (DIC), Advanced Driver Assistance Systems (ADAS) and Head-Up Display (HUD) and Augmented Reality (AR)), Vehicle Type (Passenger Vehicles and Commercial Vehicles), Level of Autonomy (L1/L2 (Driver Assistance) and L3/L4/L5 (Conditional to Full Automation)), and Geography (North America, Europe, Asia-Pacific, Middle East and Africa, and South America). The report provides the value (in USD million) for the above segments.
For Detailed Market Segmentation - Get a Free Sample PDF
Market Drivers:
- Rising Demand for Connected and Autonomous Vehicles
The global smart cockpit domain chip market was strongly driven by the growing adoption of connected and autonomous vehicles. Consumers increasingly demanded seamless in-car experiences, including advanced infotainment, digital dashboards, real-time navigation, and AI-powered assistance systems. For instance, in October 2025, Stellantis partnered with NVIDIA, Uber, and Foxconn to develop Level 4 autonomous robotaxis, advancing its global autonomous vehicle strategy. This collaboration heightened demand for connected, self-driving technologies and accelerated adoption of high-performance smart cockpit domain chips, driving growth in the global market for intelligent in-vehicle electronic systems.
Automakers sought centralized cockpit domain controllers to integrate multiple electronic functions, reduce wiring complexity, and improve efficiency, creating higher demand for advanced chips. The proliferation of autonomous driving technologies (L3–L5) required high-performance processors capable of real-time sensor data processing and decision-making. Government regulations promoting vehicle safety, telematics, and connectivity further supported adoption.
- Technological Advancements in Semiconductor and AI Integration
Technological innovation in semiconductor design and AI integration significantly propelled the smart cockpit domain chip market. Manufacturers developed energy-efficient, high-performance system-on-chip (SoC) solutions capable of supporting multi-display infotainment, voice recognition, augmented reality, and AI-driven driver assistance. Over-the-air updates, IoT connectivity, and integration with cloud services enhanced real-time functionality and personalized experiences. Collaborations between automotive OEMs, chipmakers, and software providers accelerated the development of sophisticated cockpit platforms. Advances in low-power processing, safety-compliant architectures, and AI acceleration further increased the performance of these chips while reducing energy consumption.
Market Restraints:
- High Development Costs and Integration Complexity
The global smart cockpit domain chip market faced restraints due to high development costs and integration complexity. Designing automotive-grade chips capable of supporting multiple infotainment, connectivity, and safety functions required significant R&D investment and advanced manufacturing capabilities. Integrating diverse systems into a centralized domain controller posed challenges in compatibility, software standardization, and thermal management. Smaller OEMs and suppliers often struggled to afford or implement these solutions, limiting market penetration. Additionally, ensuring cybersecurity, functional safety compliance, and regulatory approvals increased time-to-market and operational costs.
Socio-Economic Impact on Smart Cockpit Domain Chip Market
The smart cockpit domain chip market has significantly influenced both the automotive industry and broader society. By enabling safer, more connected, and intuitive in-vehicle experiences, these chips have enhanced road safety, reduced driver fatigue, and supported accessibility features. The adoption of advanced cockpit technologies has spurred high-tech employment, including software development, semiconductor manufacturing, and automotive electronics. Furthermore, increased consumer expectations for digital connectivity have driven innovation and competitiveness among automakers. Environmentally, energy-efficient chip designs have contributed to lower power consumption in electric and hybrid vehicles.
Segmental Analysis:
- In-Vehicle Infotainment (IVI) segment is expected to witness the highest growth over the forecast period
The In-Vehicle Infotainment (IVI) segment was expected to witness the highest growth due to increasing consumer demand for connected, personalized, and interactive in-car experiences. Rising adoption of touchscreen displays, voice-activated controls, augmented reality dashboards, and AI-driven infotainment systems fueled this trend. Automakers increasingly focused on centralizing cockpit functionalities, integrating multimedia, navigation, and telematics systems into a single domain controller. Growing smartphone connectivity, streaming services, and real-time cloud-based updates further enhanced consumer engagement. Additionally, advancements in semiconductor processing, AI integration, and energy-efficient chips enabled high-performance IVI systems, driving rapid adoption and expansion of the IVI segment in global smart cockpit domain chip markets.
- Passenger Vehicles segment is expected to witness the highest growth over the forecast period
The passenger vehicles segment was projected to achieve the highest growth as consumer preference shifted toward technologically advanced, connected vehicles. Increasing adoption of smart cockpit solutions, digital instrument clusters, and infotainment systems in cars drove demand for domain-specific chips. OEMs emphasized safety, comfort, and user experience enhancements through features like AI-powered voice assistants, driver monitoring, and over-the-air software updates. Rising urbanization, disposable income, and the popularity of electric and hybrid vehicles contributed to segment growth. Investments in research and development by automotive and semiconductor companies enabled integration of complex electronics in passenger vehicles, further propelling the global smart cockpit domain chip market.
- L3/L4/L5 (Conditional to Full Automation)) segment is expected to witness the highest growth over the forecast period
The L3 to L5 autonomous vehicle segment was expected to witness the fastest growth due to increasing focus on conditional to full automation technologies. Smart cockpit domain chips played a critical role in processing data from sensors, cameras, and AI algorithms to enable safe, autonomous driving. Automakers invested heavily in advanced driver-assistance systems (ADAS), navigation, and real-time decision-making capabilities that required high-performance, low-latency chip solutions. Regulatory approvals and pilot deployments of autonomous vehicles accelerated market adoption. Growing partnerships between semiconductor companies and automotive OEMs ensured the development of scalable cockpit architectures capable of supporting fully automated functionalities, driving market expansion globally.
- Asia-Pacific region is expected to witness the highest growth over the forecast period
The Asia-Pacific region was expected to witness the highest growth in the smart cockpit domain chip market due to rapid automotive production, growing consumer demand for connected vehicles, and government support for smart mobility initiatives. China, Japan, South Korea, and India emerged as major hubs for vehicle electrification, AI integration, and autonomous driving technologies. For instance, in June 2025, Chery launched the Tiggo 7 High Energy Edition, featuring SemiDrive Technology’s X9SP cockpit chip. Supporting high-reliability instruments and a 13.2-inch AI-powered digital display, this deployment boosted demand for advanced smart cockpit chips in Asia-Pacific, highlighting regional adoption of AI-driven, high-performance automotive electronics.
Rising investments by OEMs and semiconductor companies in R&D and manufacturing facilities strengthened regional capabilities. Expanding middle-class populations, urbanization, and preference for high-tech infotainment and safety systems further fueled adoption. Strategic collaborations and partnerships in the region accelerated the deployment of intelligent cockpit solutions, driving market growth in Asia-Pacific.
To Learn More About This Report - Request a Free Sample Copy
Smart Cockpit Domain Chip Market Competitive Landscape:
The competitive landscape of the smart cockpit domain chip market is characterized by global semiconductor leaders, specialized automotive chip providers, and emerging startups. Key players differentiate through high-performance processing capabilities, low power consumption, and integration of AI and connectivity features. Strategic partnerships and joint ventures between automakers, technology firms, and chip manufacturers are common, aimed at accelerating product development and market penetration. Mergers and acquisitions, particularly among startups and established players, have strengthened IP portfolios and expanded technological capabilities.
The major players for above market:
- Qualcomm Technologies
- NXP Semiconductors
- Renesas Electronics
- Texas Instruments
- Samsung Electronics (including HARMAN)
- Robert Bosch GmbH (Bosch Mobility Solutions)
- Continental AG
- Aptiv PLC
- Visteon Corporation
- Intel Corporation
- NVIDIA Corporation
- STMicroelectronics
- SemiDrive Technology
- SiEngine Technology
- MediaTek Inc.
- Telechips
- AutoChips Inc.
- Black Sesame Technologies
- Valens Semiconductor Ltd
- Harman International
Recent Development:
- In July 2025, Minda Corporation Limited partnered with Qualcomm Technologies to develop advanced smart cockpit solutions for the Indian automotive market. This strategic collaboration aimed to enhance in-vehicle infotainment, connectivity, and driver-assistance systems, strengthening both companies’ presence in India’s growing automotive electronics sector and accelerating adoption of intelligent cockpit technologies.
- In February 2021, Visteon Corporation, ECARX, and Qualcomm Technologies collaborated to develop intelligent cockpit solutions for conventional and electric vehicles. Utilizing Snapdragon Automotive Cockpit Platforms, they advanced research and commercialized integrated cockpit technologies, enhancing digital interfaces and connected experiences, addressing growing OEM demand for sophisticated, human-centric.
Frequently Asked Questions (FAQ) :
Q1. What are the main growth-driving factors for this market?
The growth is driven by consumer demand for highly digital and personalized vehicle interiors, including large HD screens and voice assistants. The major shift towards Electric Vehicles (EVs) is also key, as they rely on these powerful, centralized domain chips to manage and integrate all complex digital and autonomous vehicle functions.
Q2. What are the main restraining factors for this market?
The key restraints include the high cost of developing these complex chips and the difficulty of software integration across multiple vehicle systems. This complexity can extend testing and increase the risk of malfunctions. Furthermore, rising cybersecurity and data privacy concerns associated with highly connected cockpit platforms pose a significant challenge.
Q3. Which segment is expected to witness high growth?
The segment integrating Level 3 (L3) Autonomy features within the Electric Vehicle (EV) sector is expected to show the highest growth. L3 requires maximum computational power for automated decision-making. Since EVs are built on fully digital platforms, they are the ideal vehicle type for integrating these high-end, powerful smart cockpit domain controllers.
Q4. Who are the top major players for this market?
Top players include semiconductor companies like Qualcomm and NVIDIA, which supply the essential high-performance platforms. Traditional automotive tier-one suppliers such as Continental AG, Visteon, and Aptiv are also major players, focusing on designing and integrating these chips into the final domain control units for automakers.
Q5. Which country is the largest player?
China is the largest country player, holding the leading global market share. This is due to its high volume of domestic vehicle production and rapid adoption of both Electric Vehicles (EVs) and connected car technology. Intense local competition drives Chinese manufacturers to offer cutting-edge, feature-rich digital cockpits quickly.
List of Figures
Figure 1: Global Smart Cockpit Domain Chip Market Revenue Breakdown (USD Billion, %) by Region, 2022 & 2029
Figure 2: Global Smart Cockpit Domain Chip Market Value Share (%), By Segment 1, 2022 & 2029
Figure 3: Global Smart Cockpit Domain Chip Market Forecast (USD Billion), by Sub-Segment 1, 2018-2029
Figure 4: Global Smart Cockpit Domain Chip Market Forecast (USD Billion), by Sub-Segment 2, 2018-2029
Figure 5: Global Smart Cockpit Domain Chip Market Value Share (%), By Segment 2, 2022 & 2029
Figure 6: Global Smart Cockpit Domain Chip Market Forecast (USD Billion), by Sub-Segment 1, 2018-2029
Figure 7: Global Smart Cockpit Domain Chip Market Forecast (USD Billion), by Sub-Segment 2, 2018-2029
Figure 8: Global Smart Cockpit Domain Chip Market Forecast (USD Billion), by Sub-Segment 3, 2018-2029
Figure 9: Global Smart Cockpit Domain Chip Market Forecast (USD Billion), by Others, 2018-2029
Figure 10: Global Smart Cockpit Domain Chip Market Value Share (%), By Segment 3, 2022 & 2029
Figure 11: Global Smart Cockpit Domain Chip Market Forecast (USD Billion), by Sub-Segment 1, 2018-2029
Figure 12: Global Smart Cockpit Domain Chip Market Forecast (USD Billion), by Sub-Segment 2, 2018-2029
Figure 13: Global Smart Cockpit Domain Chip Market Forecast (USD Billion), by Sub-Segment 3, 2018-2029
Figure 14: Global Smart Cockpit Domain Chip Market Forecast (USD Billion), by Others, 2018-2029
Figure 15: Global Smart Cockpit Domain Chip Market Value (USD Billion), by Region, 2022 & 2029
Figure 16: North America Smart Cockpit Domain Chip Market Value Share (%), By Segment 1, 2022 & 2029
Figure 17: North America Smart Cockpit Domain Chip Market Forecast (USD Billion), by Sub-Segment 1, 2018-2029
Figure 18: North America Smart Cockpit Domain Chip Market Forecast (USD Billion), by Sub-Segment 2, 2018-2029
Figure 19: North America Smart Cockpit Domain Chip Market Value Share (%), By Segment 2, 2022 & 2029
Figure 20: North America Smart Cockpit Domain Chip Market Forecast (USD Billion), by Sub-Segment 1, 2018-2029
Figure 21: North America Smart Cockpit Domain Chip Market Forecast (USD Billion), by Sub-Segment 2, 2018-2029
Figure 22: North America Smart Cockpit Domain Chip Market Forecast (USD Billion), by Sub-Segment 3, 2018-2029
Figure 23: North America Smart Cockpit Domain Chip Market Forecast (USD Billion), by Others, 2018-2029
Figure 24: North America Smart Cockpit Domain Chip Market Value Share (%), By Segment 3, 2022 & 2029
Figure 25: North America Smart Cockpit Domain Chip Market Forecast (USD Billion), by Sub-Segment 1, 2018-2029
Figure 26: North America Smart Cockpit Domain Chip Market Forecast (USD Billion), by Sub-Segment 2, 2018-2029
Figure 27: North America Smart Cockpit Domain Chip Market Forecast (USD Billion), by Sub-Segment 3, 2018-2029
Figure 28: North America Smart Cockpit Domain Chip Market Forecast (USD Billion), by Others, 2018-2029
Figure 29: North America Smart Cockpit Domain Chip Market Forecast (USD Billion), by U.S., 2018-2029
Figure 30: North America Smart Cockpit Domain Chip Market Forecast (USD Billion), by Canada, 2018-2029
Figure 31: Latin America Smart Cockpit Domain Chip Market Value Share (%), By Segment 1, 2022 & 2029
Figure 32: Latin America Smart Cockpit Domain Chip Market Forecast (USD Billion), by Sub-Segment 1, 2018-2029
Figure 33: Latin America Smart Cockpit Domain Chip Market Forecast (USD Billion), by Sub-Segment 2, 2018-2029
Figure 34: Latin America Smart Cockpit Domain Chip Market Value Share (%), By Segment 2, 2022 & 2029
Figure 35: Latin America Smart Cockpit Domain Chip Market Forecast (USD Billion), by Sub-Segment 1, 2018-2029
Figure 36: Latin America Smart Cockpit Domain Chip Market Forecast (USD Billion), by Sub-Segment 2, 2018-2029
Figure 37: Latin America Smart Cockpit Domain Chip Market Forecast (USD Billion), by Sub-Segment 3, 2018-2029
Figure 38: Latin America Smart Cockpit Domain Chip Market Forecast (USD Billion), by Others, 2018-2029
Figure 39: Latin America Smart Cockpit Domain Chip Market Value Share (%), By Segment 3, 2022 & 2029
Figure 40: Latin America Smart Cockpit Domain Chip Market Forecast (USD Billion), by Sub-Segment 1, 2018-2029
Figure 41: Latin America Smart Cockpit Domain Chip Market Forecast (USD Billion), by Sub-Segment 2, 2018-2029
Figure 42: Latin America Smart Cockpit Domain Chip Market Forecast (USD Billion), by Sub-Segment 3, 2018-2029
Figure 43: Latin America Smart Cockpit Domain Chip Market Forecast (USD Billion), by Others, 2018-2029
Figure 44: Latin America Smart Cockpit Domain Chip Market Forecast (USD Billion), by Brazil, 2018-2029
Figure 45: Latin America Smart Cockpit Domain Chip Market Forecast (USD Billion), by Mexico, 2018-2029
Figure 46: Latin America Smart Cockpit Domain Chip Market Forecast (USD Billion), by Rest of Latin America, 2018-2029
Figure 47: Europe Smart Cockpit Domain Chip Market Value Share (%), By Segment 1, 2022 & 2029
Figure 48: Europe Smart Cockpit Domain Chip Market Forecast (USD Billion), by Sub-Segment 1, 2018-2029
Figure 49: Europe Smart Cockpit Domain Chip Market Forecast (USD Billion), by Sub-Segment 2, 2018-2029
Figure 50: Europe Smart Cockpit Domain Chip Market Value Share (%), By Segment 2, 2022 & 2029
Figure 51: Europe Smart Cockpit Domain Chip Market Forecast (USD Billion), by Sub-Segment 1, 2018-2029
Figure 52: Europe Smart Cockpit Domain Chip Market Forecast (USD Billion), by Sub-Segment 2, 2018-2029
Figure 53: Europe Smart Cockpit Domain Chip Market Forecast (USD Billion), by Sub-Segment 3, 2018-2029
Figure 54: Europe Smart Cockpit Domain Chip Market Forecast (USD Billion), by Others, 2018-2029
Figure 55: Europe Smart Cockpit Domain Chip Market Value Share (%), By Segment 3, 2022 & 2029
Figure 56: Europe Smart Cockpit Domain Chip Market Forecast (USD Billion), by Sub-Segment 1, 2018-2029
Figure 57: Europe Smart Cockpit Domain Chip Market Forecast (USD Billion), by Sub-Segment 2, 2018-2029
Figure 58: Europe Smart Cockpit Domain Chip Market Forecast (USD Billion), by Sub-Segment 3, 2018-2029
Figure 59: Europe Smart Cockpit Domain Chip Market Forecast (USD Billion), by Others, 2018-2029
Figure 60: Europe Smart Cockpit Domain Chip Market Forecast (USD Billion), by U.K., 2018-2029
Figure 61: Europe Smart Cockpit Domain Chip Market Forecast (USD Billion), by Germany, 2018-2029
Figure 62: Europe Smart Cockpit Domain Chip Market Forecast (USD Billion), by France, 2018-2029
Figure 63: Europe Smart Cockpit Domain Chip Market Forecast (USD Billion), by Italy, 2018-2029
Figure 64: Europe Smart Cockpit Domain Chip Market Forecast (USD Billion), by Spain, 2018-2029
Figure 65: Europe Smart Cockpit Domain Chip Market Forecast (USD Billion), by Russia, 2018-2029
Figure 66: Europe Smart Cockpit Domain Chip Market Forecast (USD Billion), by Rest of Europe, 2018-2029
Figure 67: Asia Pacific Smart Cockpit Domain Chip Market Value Share (%), By Segment 1, 2022 & 2029
Figure 68: Asia Pacific Smart Cockpit Domain Chip Market Forecast (USD Billion), by Sub-Segment 1, 2018-2029
Figure 69: Asia Pacific Smart Cockpit Domain Chip Market Forecast (USD Billion), by Sub-Segment 2, 2018-2029
Figure 70: Asia Pacific Smart Cockpit Domain Chip Market Value Share (%), By Segment 2, 2022 & 2029
Figure 71: Asia Pacific Smart Cockpit Domain Chip Market Forecast (USD Billion), by Sub-Segment 1, 2018-2029
Figure 72: Asia Pacific Smart Cockpit Domain Chip Market Forecast (USD Billion), by Sub-Segment 2, 2018-2029
Figure 73: Asia Pacific Smart Cockpit Domain Chip Market Forecast (USD Billion), by Sub-Segment 3, 2018-2029
Figure 74: Asia Pacific Smart Cockpit Domain Chip Market Forecast (USD Billion), by Others, 2018-2029
Figure 75: Asia Pacific Smart Cockpit Domain Chip Market Value Share (%), By Segment 3, 2022 & 2029
Figure 76: Asia Pacific Smart Cockpit Domain Chip Market Forecast (USD Billion), by Sub-Segment 1, 2018-2029
Figure 77: Asia Pacific Smart Cockpit Domain Chip Market Forecast (USD Billion), by Sub-Segment 2, 2018-2029
Figure 78: Asia Pacific Smart Cockpit Domain Chip Market Forecast (USD Billion), by Sub-Segment 3, 2018-2029
Figure 79: Asia Pacific Smart Cockpit Domain Chip Market Forecast (USD Billion), by Others, 2018-2029
Figure 80: Asia Pacific Smart Cockpit Domain Chip Market Forecast (USD Billion), by China, 2018-2029
Figure 81: Asia Pacific Smart Cockpit Domain Chip Market Forecast (USD Billion), by India, 2018-2029
Figure 82: Asia Pacific Smart Cockpit Domain Chip Market Forecast (USD Billion), by Japan, 2018-2029
Figure 83: Asia Pacific Smart Cockpit Domain Chip Market Forecast (USD Billion), by Australia, 2018-2029
Figure 84: Asia Pacific Smart Cockpit Domain Chip Market Forecast (USD Billion), by Southeast Asia, 2018-2029
Figure 85: Asia Pacific Smart Cockpit Domain Chip Market Forecast (USD Billion), by Rest of Asia Pacific, 2018-2029
Figure 86: Middle East & Africa Smart Cockpit Domain Chip Market Value Share (%), By Segment 1, 2022 & 2029
Figure 87: Middle East & Africa Smart Cockpit Domain Chip Market Forecast (USD Billion), by Sub-Segment 1, 2018-2029
Figure 88: Middle East & Africa Smart Cockpit Domain Chip Market Forecast (USD Billion), by Sub-Segment 2, 2018-2029
Figure 89: Middle East & Africa Smart Cockpit Domain Chip Market Value Share (%), By Segment 2, 2022 & 2029
Figure 90: Middle East & Africa Smart Cockpit Domain Chip Market Forecast (USD Billion), by Sub-Segment 1, 2018-2029
Figure 91: Middle East & Africa Smart Cockpit Domain Chip Market Forecast (USD Billion), by Sub-Segment 2, 2018-2029
Figure 92: Middle East & Africa Smart Cockpit Domain Chip Market Forecast (USD Billion), by Sub-Segment 3, 2018-2029
Figure 93: Middle East & Africa Smart Cockpit Domain Chip Market Forecast (USD Billion), by Others, 2018-2029
Figure 94: Middle East & Africa Smart Cockpit Domain Chip Market Value Share (%), By Segment 3, 2022 & 2029
Figure 95: Middle East & Africa Smart Cockpit Domain Chip Market Forecast (USD Billion), by Sub-Segment 1, 2018-2029
Figure 96: Middle East & Africa Smart Cockpit Domain Chip Market Forecast (USD Billion), by Sub-Segment 2, 2018-2029
Figure 97: Middle East & Africa Smart Cockpit Domain Chip Market Forecast (USD Billion), by Sub-Segment 3, 2018-2029
Figure 98: Middle East & Africa Smart Cockpit Domain Chip Market Forecast (USD Billion), by Others, 2018-2029
Figure 99: Middle East & Africa Smart Cockpit Domain Chip Market Forecast (USD Billion), by GCC, 2018-2029
Figure 100: Middle East & Africa Smart Cockpit Domain Chip Market Forecast (USD Billion), by South Africa, 2018-2029
Figure 101: Middle East & Africa Smart Cockpit Domain Chip Market Forecast (USD Billion), by Rest of Middle East & Africa, 2018-2029
List of Tables
Table 1: Global Smart Cockpit Domain Chip Market Revenue (USD Billion) Forecast, by Segment 1, 2018-2029
Table 2: Global Smart Cockpit Domain Chip Market Revenue (USD Billion) Forecast, by Segment 2, 2018-2029
Table 3: Global Smart Cockpit Domain Chip Market Revenue (USD Billion) Forecast, by Segment 3, 2018-2029
Table 4: Global Smart Cockpit Domain Chip Market Revenue (USD Billion) Forecast, by Region, 2018-2029
Table 5: North America Smart Cockpit Domain Chip Market Revenue (USD Billion) Forecast, by Segment 1, 2018-2029
Table 6: North America Smart Cockpit Domain Chip Market Revenue (USD Billion) Forecast, by Segment 2, 2018-2029
Table 7: North America Smart Cockpit Domain Chip Market Revenue (USD Billion) Forecast, by Segment 3, 2018-2029
Table 8: North America Smart Cockpit Domain Chip Market Revenue (USD Billion) Forecast, by Country, 2018-2029
Table 9: Europe Smart Cockpit Domain Chip Market Revenue (USD Billion) Forecast, by Segment 1, 2018-2029
Table 10: Europe Smart Cockpit Domain Chip Market Revenue (USD Billion) Forecast, by Segment 2, 2018-2029
Table 11: Europe Smart Cockpit Domain Chip Market Revenue (USD Billion) Forecast, by Segment 3, 2018-2029
Table 12: Europe Smart Cockpit Domain Chip Market Revenue (USD Billion) Forecast, by Country, 2018-2029
Table 13: Latin America Smart Cockpit Domain Chip Market Revenue (USD Billion) Forecast, by Segment 1, 2018-2029
Table 14: Latin America Smart Cockpit Domain Chip Market Revenue (USD Billion) Forecast, by Segment 2, 2018-2029
Table 15: Latin America Smart Cockpit Domain Chip Market Revenue (USD Billion) Forecast, by Segment 3, 2018-2029
Table 16: Latin America Smart Cockpit Domain Chip Market Revenue (USD Billion) Forecast, by Country, 2018-2029
Table 17: Asia Pacific Smart Cockpit Domain Chip Market Revenue (USD Billion) Forecast, by Segment 1, 2018-2029
Table 18: Asia Pacific Smart Cockpit Domain Chip Market Revenue (USD Billion) Forecast, by Segment 2, 2018-2029
Table 19: Asia Pacific Smart Cockpit Domain Chip Market Revenue (USD Billion) Forecast, by Segment 3, 2018-2029
Table 20: Asia Pacific Smart Cockpit Domain Chip Market Revenue (USD Billion) Forecast, by Country, 2018-2029
Table 21: Middle East & Africa Smart Cockpit Domain Chip Market Revenue (USD Billion) Forecast, by Segment 1, 2018-2029
Table 22: Middle East & Africa Smart Cockpit Domain Chip Market Revenue (USD Billion) Forecast, by Segment 2, 2018-2029
Table 23: Middle East & Africa Smart Cockpit Domain Chip Market Revenue (USD Billion) Forecast, by Segment 3, 2018-2029
Table 24: Middle East & Africa Smart Cockpit Domain Chip Market Revenue (USD Billion) Forecast, by Country, 2018-2029
Research Process
Data Library Research are conducted by industry experts who offer insight on
industry structure, market segmentations technology assessment and competitive landscape (CL), and penetration, as well as on emerging trends. Their analysis is based on primary interviews (~ 80%) and secondary research (~ 20%) as well as years of professional expertise in their respective industries. Adding to this, by analysing historical trends and current market positions, our analysts predict where the market will be headed for the next five years. Furthermore, the varying trends of segment & categories geographically presented are also studied and the estimated based on the primary & secondary research.
In this particular report from the supply side Data Library Research has conducted primary surveys (interviews) with the key level executives (VP, CEO’s, Marketing Director, Business Development Manager
and SOFT) of the companies that active & prominent as well as the midsized organization
FIGURE 1: DLR RESEARH PROCESS
![research-methodology1]()
Primary Research
Extensive primary research was conducted to gain a deeper insight of the market and industry performance. The analysis is based on both primary and secondary research as well as years of professional expertise in the respective industries.
In addition to analysing current and historical trends, our analysts predict where the market is headed over the next five years.
It varies by segment for these categories geographically presented in the list of market tables. Speaking about this particular report we have conducted primary surveys (interviews) with the key level executives (VP, CEO’s, Marketing Director, Business Development Manager and many more) of the major players active in the market.
Secondary Research
Secondary research was mainly used to collect and identify information useful for the extensive, technical, market-oriented, and Friend’s study of the Global Extra Neutral Alcohol. It was also used to obtain key information about major players, market classification and segmentation according to the industry trends, geographical markets, and developments related to the market and technology perspectives. For this study, analysts have gathered information from various credible sources, such as annual reports, sec filings, journals, white papers, SOFT presentations, and company web sites.
Market Size Estimation
Both, top-down and bottom-up approaches were used to estimate and validate the size of the Global market and to estimate the size of various other dependent submarkets in the overall Extra Neutral Alcohol. The key players in the market were identified through secondary research and their market contributions in the respective geographies were determined through primary and secondary research.
Forecast Model
![research-methodology2]()