Smart Wearable TFT-LCD Driver Chip Market Overview and Analysis:
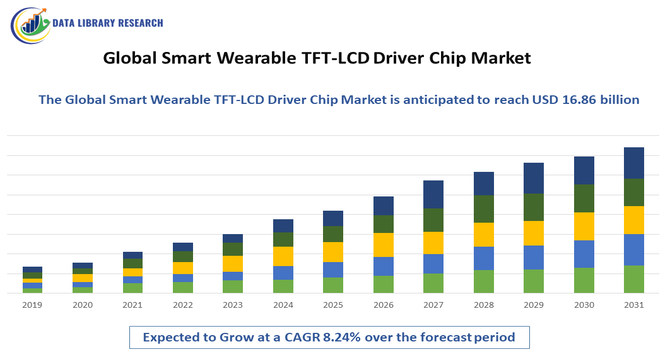
- The Global Smart Wearable TFT LCD Driver Chip Market is expected to reach USD 7.91 billion in 2025 and grow at a CAGR of 8.24% to reach USD 16.86 billion by 2032.
Get Complete Analysis Of The Report - Download Updated Free Sample PDF
The Global Smart Wearable TFT LCD Driver Chip Market is experiencing robust growth driven primarily by the rapid proliferation of smart wearable devices such as smartwatches, fitness trackers, smart glasses, and health monitoring gadgets. As consumers increasingly adopt wearables that offer advanced functionality — including real time health tracking, fitness analytics, and seamless connectivity — demand for sophisticated display solutions has surged. These devices require high-performance, energy-efficient TFT LCD driver chips to support high-resolution displays, compact form factors, and extended battery life, directly propelling market expansion.
Smart Wearable TFT-LCD Driver Chip Market Latest Trends
The Global Smart Wearable TFT LCD Driver Chip Market is evolving with several dynamic trends that are enhancing display performance, functionality, and user experience in wearable devices. A key trend is the integration of advanced technologies such as AI and flexible displays, enabling driver chips to optimize display parameters like brightness, contrast, and power consumption in real time based on user activity and environment, which improves both battery life and usability. Manufacturers are also focusing on miniaturization and power efficiency, developing smaller, ultra-low power driver chips to support compact wearables like smartwatches and fitness trackers without compromising display quality. Additionally, there is a growing push toward supporting innovative display types — including flexible and transparent TFT LCD screens — which opens new design possibilities for smart glasses, fashion tech, and health monitoring devices.
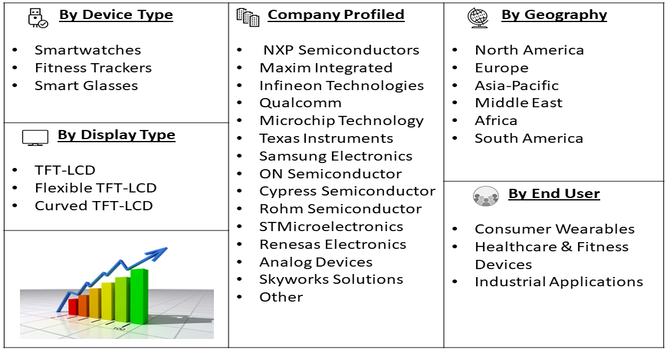
Segmentation: Global Smart Wearable TFT-LCD Driver Chip Market is segmented By Device Type (Smartwatches, Fitness Trackers, Smart Glasses), Display Type (TFT-LCD, Flexible TFT-LCD, Curved TFT-LCD), By Resolution (HD, Full HD, QHD), By End-User (Consumer Wearables, Healthcare & Fitness Devices, Industrial Applications), and Geography (North America, Europe, Asia-Pacific, Middle East and Africa, and South America). The report provides the value (in USD million) for the above segments.
For Detailed Market Segmentation - Get a Free Sample PDF
Market Drivers:
- Rapid Adoption of Smart Wearable Devices
A primary driver of the market is the explosive growth in demand for smart wearable devices such as smartwatches, fitness trackers, and smart glasses. Consumers increasingly prefer wearables that provide real-time health monitoring, fitness tracking, notifications, and connectivity with smartphones or other devices. These devices rely on high-performance TFT LCD displays to provide clear visuals in compact form factors. The surge in wearable adoption across fitness, healthcare, and lifestyle applications directly fuels demand for advanced driver chips capable of supporting high-resolution displays, efficient power consumption, and seamless user experiences, thereby driving market growth globally.
- Advancements in Display and Semiconductor Technologies
Technological innovation in TFT LCD driver chips is another key growth driver. Manufacturers are developing energy-efficient, miniaturized, and high-speed driver chips that support features like flexible, curved, and high-resolution displays. Integration with AI and sensor technologies allows dynamic adjustment of brightness, contrast, and refresh rates, enhancing user experience while optimizing battery life. Additionally, ongoing improvements in semiconductor fabrication and packaging technologies enable compact designs suitable for small wearable devices. These innovations not only improve display performance but also expand the functionality of wearable devices, further propelling demand for smart wearable TFT LCD driver chips.
Market Restraints:
- High Production and Component Costs
A major restraint for the market is the high cost of advanced TFT LCD driver chips and related components. Manufacturing high-resolution, low-power, and miniaturized driver chips requires sophisticated semiconductor fabrication processes, precision engineering, and strict quality control. These high production costs can limit adoption, particularly in budget-conscious consumer segments or emerging markets where price sensitivity is significant. Additionally, the integration of advanced features such as flexible or curved displays increases design and manufacturing complexity, further raising costs and potentially slowing market penetration.
Socioeconomic Impact on Smart Wearable TFT-LCD Driver Chip Market
The Global Smart Wearable TFT-LCD Driver Chip Market has generated meaningful socioeconomic impact by enabling affordable, energy-efficient display technologies in smartwatches, fitness bands, and medical wearables. Widespread adoption supported digital health monitoring, early disease detection, and remote patient engagement, reducing healthcare burdens and costs. Growth in this market stimulated high-skilled employment across semiconductor design, manufacturing, and software integration. Expanding wearable usage also enhanced workplace safety, productivity, and personal wellness awareness. In emerging economies, lower-cost driver chips improved access to smart devices, fostering digital inclusion. Overall, the market contributed to healthier lifestyles, technological upskilling, and resilient electronics supply chains globally and innovation ecosystems.
Segmental Analysis:
- Smartwatches segment is expected to witness highest growth over the forecast period
The smartwatches segment is a major contributor to the market due to the widespread adoption of these devices for health monitoring, fitness tracking, notifications, and mobile connectivity. Smartwatches require compact, high-performance TFT LCD driver chips to support high-resolution displays in a small form factor while ensuring energy efficiency for prolonged battery life. The growing popularity of premium and multi-functional smartwatches globally is driving demand for advanced driver chips capable of delivering crisp visuals and seamless user experience.
- Flexible TFT-LCD segment is expected to witness highest growth over the forecast period
The flexible TFT-LCD segment is witnessing strong growth as manufacturers explore innovative wearable designs such as curved or wrap-around displays for smart glasses, health bands, and next-generation smartwatches. Flexible driver chips allow bending without loss of performance, enabling slimmer and more ergonomic devices. These chips also support adaptive display features like dynamic brightness and refresh rate adjustments, which enhance usability and battery efficiency. Flexible TFT-LCD technology is increasingly being adopted in premium wearables, driving demand for specialized driver chips.
- Full HD segment is expected to witness the highest growth over the forecast period
The Full HD resolution segment is gaining traction as consumers demand high-quality visuals on wearable devices for improved readability, media playback, and health monitoring applications. TFT LCD driver chips designed for Full HD displays ensure sharp image quality and accurate color reproduction while maintaining low power consumption. As wearable devices evolve to offer richer visual experiences, such as interactive fitness apps, notifications, and AR features, Full HD driver chips become essential for performance and user satisfaction.
- Healthcare & Fitness Devices segment is expected to witness the highest growth over the forecast period
The healthcare & fitness devices segment is a key driver of market growth, as wearables increasingly incorporate real-time monitoring of heart rate, blood oxygen levels, sleep patterns, and other vital parameters. These applications rely on high-performance TFT LCD driver chips to display accurate data clearly and continuously, enabling healthcare providers and users to make timely decisions. The rising demand for remote health monitoring and preventive care is further accelerating the adoption of advanced wearable displays in this segment.
- North America segment is expected to witness the highest growth over the forecast period
North America is the leading region in the smart wearable TFT LCD driver chip market, driven by high disposable income, advanced healthcare infrastructure, and early adoption of wearable technologies. The presence of major tech companies, innovative product launches, and supportive government policies for digital health and connected devices contribute to the market’s robust growth. North American consumers’ preference for premium smartwatches and fitness devices with high-quality displays further strengthens demand for advanced TFT LCD driver chips.
Additionally, strong investments in semiconductor R&D and a well-established supply chain ecosystem support rapid innovation and large-scale commercialization of TFT LCD driver chips in North America. Collaboration between chip manufacturers, wearable device brands, and healthcare providers further accelerates adoption, positioning the region as a hub for next-generation smart wearable technologies.
| Report Matrics |
Details |
| Market Size Value |
USD 16.86 billion |
| Growth Rate |
CAGR of 8.24% |
| Forecast |
2026-2033 |
| Historical data |
2021-2024 |
| Base Year |
2025 |
| Report Coverage |
Forecasted revenue, company rating, competitive environment, growth drivers, and trends |
| Segment Coverage |
Type, Application, End-User, Geography |
| Regional Scope |
North America, Europe, Asia Pacific, Middle East |
| Customized scope |
Free customization of reports (With 3 months Analysis Support ) |
| To Learn More About This Report |
Request a Free Sample Copy |
Smart Wearable TFT-LCD Driver Chip Market Competitive Landscape:
The Global Smart Wearable TFT LCD Driver Chip Market is highly competitive and characterized by the presence of leading semiconductor manufacturers and specialized IC design firms that are actively innovating to meet the growing demand for high performance, energy efficient driver chips in smart wearable devices such as smartwatches, fitness trackers, and smart glasses. Players in this market compete on technological capabilities, miniaturization, low power consumption, integration with advanced display types, and strategic collaborations with wearable OEMs to secure design wins and expand global footprint. Robust R&D investments and partnerships are key strategies companies use to enhance product portfolios and stay ahead in this rapidly evolving market landscape.
Key Players:
- NXP Semiconductors
- Maxim Integrated
- Infineon Technologies
- Qualcomm
- Microchip Technology
- Texas Instruments
- Samsung Electronics
- ON Semiconductor
- Cypress Semiconductor
- Rohm Semiconductor
- STMicroelectronics
- Renesas Electronics
- Analog Devices
- Skyworks Solutions
- Novatek Microelectronics
- Ilitek Technology
- Focaltech Systems
- Himax Technologies
- Will Semiconductor
- Jadard Technology
Recent Development
- In 2025, Himax and Liqxtal’s showcase of the Pro-Eye vision-care monitor had strengthened the Global Smart Wearable TFT-LCD Driver Chip Market by highlighting advanced integration of AI-enabled eye tracking with high-performance display drivers. The research-backed benefits in reducing eye strain and pseudo-myopia reinforced demand for intelligent, health-focused displays, encouraging broader adoption of advanced TFT-LCD driver chips across wearable and vision-care applications worldwide.
- In 2025, AUO and Garmin’s launch of the fēnix 8 Pro MicroLED smartwatch strengthened the Global Smart Wearable TFT-LCD Driver Chip Market by demonstrating the demand for high-performance, ultra-dense displays in wearable devices. The integration of Micro LED technology highlighted the need for advanced driver chips to support superior brightness, contrast, and color accuracy, driving innovation and adoption of next-generation TFT-LCD driver solutions in premium smartwatches and fitness wearables worldwide.
Frequently Asked Questions (FAQ) :
Q1. What are the main growth-driving factors for this market?
The market is growing because more people are using smartwatches and fitness trackers to monitor their health. As users demand brighter, clearer, and more colorful screens, manufacturers need advanced driver chips to manage high resolutions. Additionally, the shift toward energy-efficient displays that save battery life is a major reason for the increased demand for these specialized chips.
Q2. What are the main restraining factors for this market?
Growth is limited by the high cost of making smaller, more powerful chips and the global shortage of semiconductor manufacturing materials. Intense price competition among tech companies also makes it hard for chip makers to stay profitable. Furthermore, the rapid move toward newer OLED screen technology can sometimes reduce the demand for traditional TFT-LCD chips in premium devices.
Q3. Which segment is expected to witness high growth?
The smartwatches segment is expected to witness the highest growth over the forecast period due to rising health consciousness, growing adoption of fitness and medical monitoring features, and continuous innovation in display quality, battery efficiency, and compact TFT-LCD driver chip integration across consumer and healthcare applications.
Q4. Who are the top major players for this market?
The market is led by global semiconductor experts who specialize in display technology. Key players include Samsung Electronics, Novatek Microelectronics, Himax Technologies, Texas Instruments, and Microchip Technology. These companies dominate by creating "all-in-one" chips that combine display driving with touch sensitivity, making wearable devices more responsive and easier to build.
Q5. Which country is the largest player?
United States is the largest player in this market. It is the world’s hub for electronics manufacturing, home to both the factories that build the wearable devices and the companies that produce the display panels. With a massive population of tech-savvy consumers and strong government support for the chip industry, China leads in both production and sales.
List of Figures
Figure 1: Global Smart Wearable TFT-LCD Driver Chip Market Revenue Breakdown (USD Billion, %) by Region, 2022 & 2029
Figure 2: Global Smart Wearable TFT-LCD Driver Chip Market Value Share (%), By Segment 1, 2022 & 2029
Figure 3: Global Smart Wearable TFT-LCD Driver Chip Market Forecast (USD Billion), by Sub-Segment 1, 2018-2029
Figure 4: Global Smart Wearable TFT-LCD Driver Chip Market Forecast (USD Billion), by Sub-Segment 2, 2018-2029
Figure 5: Global Smart Wearable TFT-LCD Driver Chip Market Value Share (%), By Segment 2, 2022 & 2029
Figure 6: Global Smart Wearable TFT-LCD Driver Chip Market Forecast (USD Billion), by Sub-Segment 1, 2018-2029
Figure 7: Global Smart Wearable TFT-LCD Driver Chip Market Forecast (USD Billion), by Sub-Segment 2, 2018-2029
Figure 8: Global Smart Wearable TFT-LCD Driver Chip Market Forecast (USD Billion), by Sub-Segment 3, 2018-2029
Figure 9: Global Smart Wearable TFT-LCD Driver Chip Market Forecast (USD Billion), by Others, 2018-2029
Figure 10: Global Smart Wearable TFT-LCD Driver Chip Market Value Share (%), By Segment 3, 2022 & 2029
Figure 11: Global Smart Wearable TFT-LCD Driver Chip Market Forecast (USD Billion), by Sub-Segment 1, 2018-2029
Figure 12: Global Smart Wearable TFT-LCD Driver Chip Market Forecast (USD Billion), by Sub-Segment 2, 2018-2029
Figure 13: Global Smart Wearable TFT-LCD Driver Chip Market Forecast (USD Billion), by Sub-Segment 3, 2018-2029
Figure 14: Global Smart Wearable TFT-LCD Driver Chip Market Forecast (USD Billion), by Others, 2018-2029
Figure 15: Global Smart Wearable TFT-LCD Driver Chip Market Value (USD Billion), by Region, 2022 & 2029
Figure 16: North America Smart Wearable TFT-LCD Driver Chip Market Value Share (%), By Segment 1, 2022 & 2029
Figure 17: North America Smart Wearable TFT-LCD Driver Chip Market Forecast (USD Billion), by Sub-Segment 1, 2018-2029
Figure 18: North America Smart Wearable TFT-LCD Driver Chip Market Forecast (USD Billion), by Sub-Segment 2, 2018-2029
Figure 19: North America Smart Wearable TFT-LCD Driver Chip Market Value Share (%), By Segment 2, 2022 & 2029
Figure 20: North America Smart Wearable TFT-LCD Driver Chip Market Forecast (USD Billion), by Sub-Segment 1, 2018-2029
Figure 21: North America Smart Wearable TFT-LCD Driver Chip Market Forecast (USD Billion), by Sub-Segment 2, 2018-2029
Figure 22: North America Smart Wearable TFT-LCD Driver Chip Market Forecast (USD Billion), by Sub-Segment 3, 2018-2029
Figure 23: North America Smart Wearable TFT-LCD Driver Chip Market Forecast (USD Billion), by Others, 2018-2029
Figure 24: North America Smart Wearable TFT-LCD Driver Chip Market Value Share (%), By Segment 3, 2022 & 2029
Figure 25: North America Smart Wearable TFT-LCD Driver Chip Market Forecast (USD Billion), by Sub-Segment 1, 2018-2029
Figure 26: North America Smart Wearable TFT-LCD Driver Chip Market Forecast (USD Billion), by Sub-Segment 2, 2018-2029
Figure 27: North America Smart Wearable TFT-LCD Driver Chip Market Forecast (USD Billion), by Sub-Segment 3, 2018-2029
Figure 28: North America Smart Wearable TFT-LCD Driver Chip Market Forecast (USD Billion), by Others, 2018-2029
Figure 29: North America Smart Wearable TFT-LCD Driver Chip Market Forecast (USD Billion), by U.S., 2018-2029
Figure 30: North America Smart Wearable TFT-LCD Driver Chip Market Forecast (USD Billion), by Canada, 2018-2029
Figure 31: Latin America Smart Wearable TFT-LCD Driver Chip Market Value Share (%), By Segment 1, 2022 & 2029
Figure 32: Latin America Smart Wearable TFT-LCD Driver Chip Market Forecast (USD Billion), by Sub-Segment 1, 2018-2029
Figure 33: Latin America Smart Wearable TFT-LCD Driver Chip Market Forecast (USD Billion), by Sub-Segment 2, 2018-2029
Figure 34: Latin America Smart Wearable TFT-LCD Driver Chip Market Value Share (%), By Segment 2, 2022 & 2029
Figure 35: Latin America Smart Wearable TFT-LCD Driver Chip Market Forecast (USD Billion), by Sub-Segment 1, 2018-2029
Figure 36: Latin America Smart Wearable TFT-LCD Driver Chip Market Forecast (USD Billion), by Sub-Segment 2, 2018-2029
Figure 37: Latin America Smart Wearable TFT-LCD Driver Chip Market Forecast (USD Billion), by Sub-Segment 3, 2018-2029
Figure 38: Latin America Smart Wearable TFT-LCD Driver Chip Market Forecast (USD Billion), by Others, 2018-2029
Figure 39: Latin America Smart Wearable TFT-LCD Driver Chip Market Value Share (%), By Segment 3, 2022 & 2029
Figure 40: Latin America Smart Wearable TFT-LCD Driver Chip Market Forecast (USD Billion), by Sub-Segment 1, 2018-2029
Figure 41: Latin America Smart Wearable TFT-LCD Driver Chip Market Forecast (USD Billion), by Sub-Segment 2, 2018-2029
Figure 42: Latin America Smart Wearable TFT-LCD Driver Chip Market Forecast (USD Billion), by Sub-Segment 3, 2018-2029
Figure 43: Latin America Smart Wearable TFT-LCD Driver Chip Market Forecast (USD Billion), by Others, 2018-2029
Figure 44: Latin America Smart Wearable TFT-LCD Driver Chip Market Forecast (USD Billion), by Brazil, 2018-2029
Figure 45: Latin America Smart Wearable TFT-LCD Driver Chip Market Forecast (USD Billion), by Mexico, 2018-2029
Figure 46: Latin America Smart Wearable TFT-LCD Driver Chip Market Forecast (USD Billion), by Rest of Latin America, 2018-2029
Figure 47: Europe Smart Wearable TFT-LCD Driver Chip Market Value Share (%), By Segment 1, 2022 & 2029
Figure 48: Europe Smart Wearable TFT-LCD Driver Chip Market Forecast (USD Billion), by Sub-Segment 1, 2018-2029
Figure 49: Europe Smart Wearable TFT-LCD Driver Chip Market Forecast (USD Billion), by Sub-Segment 2, 2018-2029
Figure 50: Europe Smart Wearable TFT-LCD Driver Chip Market Value Share (%), By Segment 2, 2022 & 2029
Figure 51: Europe Smart Wearable TFT-LCD Driver Chip Market Forecast (USD Billion), by Sub-Segment 1, 2018-2029
Figure 52: Europe Smart Wearable TFT-LCD Driver Chip Market Forecast (USD Billion), by Sub-Segment 2, 2018-2029
Figure 53: Europe Smart Wearable TFT-LCD Driver Chip Market Forecast (USD Billion), by Sub-Segment 3, 2018-2029
Figure 54: Europe Smart Wearable TFT-LCD Driver Chip Market Forecast (USD Billion), by Others, 2018-2029
Figure 55: Europe Smart Wearable TFT-LCD Driver Chip Market Value Share (%), By Segment 3, 2022 & 2029
Figure 56: Europe Smart Wearable TFT-LCD Driver Chip Market Forecast (USD Billion), by Sub-Segment 1, 2018-2029
Figure 57: Europe Smart Wearable TFT-LCD Driver Chip Market Forecast (USD Billion), by Sub-Segment 2, 2018-2029
Figure 58: Europe Smart Wearable TFT-LCD Driver Chip Market Forecast (USD Billion), by Sub-Segment 3, 2018-2029
Figure 59: Europe Smart Wearable TFT-LCD Driver Chip Market Forecast (USD Billion), by Others, 2018-2029
Figure 60: Europe Smart Wearable TFT-LCD Driver Chip Market Forecast (USD Billion), by U.K., 2018-2029
Figure 61: Europe Smart Wearable TFT-LCD Driver Chip Market Forecast (USD Billion), by Germany, 2018-2029
Figure 62: Europe Smart Wearable TFT-LCD Driver Chip Market Forecast (USD Billion), by France, 2018-2029
Figure 63: Europe Smart Wearable TFT-LCD Driver Chip Market Forecast (USD Billion), by Italy, 2018-2029
Figure 64: Europe Smart Wearable TFT-LCD Driver Chip Market Forecast (USD Billion), by Spain, 2018-2029
Figure 65: Europe Smart Wearable TFT-LCD Driver Chip Market Forecast (USD Billion), by Russia, 2018-2029
Figure 66: Europe Smart Wearable TFT-LCD Driver Chip Market Forecast (USD Billion), by Rest of Europe, 2018-2029
Figure 67: Asia Pacific Smart Wearable TFT-LCD Driver Chip Market Value Share (%), By Segment 1, 2022 & 2029
Figure 68: Asia Pacific Smart Wearable TFT-LCD Driver Chip Market Forecast (USD Billion), by Sub-Segment 1, 2018-2029
Figure 69: Asia Pacific Smart Wearable TFT-LCD Driver Chip Market Forecast (USD Billion), by Sub-Segment 2, 2018-2029
Figure 70: Asia Pacific Smart Wearable TFT-LCD Driver Chip Market Value Share (%), By Segment 2, 2022 & 2029
Figure 71: Asia Pacific Smart Wearable TFT-LCD Driver Chip Market Forecast (USD Billion), by Sub-Segment 1, 2018-2029
Figure 72: Asia Pacific Smart Wearable TFT-LCD Driver Chip Market Forecast (USD Billion), by Sub-Segment 2, 2018-2029
Figure 73: Asia Pacific Smart Wearable TFT-LCD Driver Chip Market Forecast (USD Billion), by Sub-Segment 3, 2018-2029
Figure 74: Asia Pacific Smart Wearable TFT-LCD Driver Chip Market Forecast (USD Billion), by Others, 2018-2029
Figure 75: Asia Pacific Smart Wearable TFT-LCD Driver Chip Market Value Share (%), By Segment 3, 2022 & 2029
Figure 76: Asia Pacific Smart Wearable TFT-LCD Driver Chip Market Forecast (USD Billion), by Sub-Segment 1, 2018-2029
Figure 77: Asia Pacific Smart Wearable TFT-LCD Driver Chip Market Forecast (USD Billion), by Sub-Segment 2, 2018-2029
Figure 78: Asia Pacific Smart Wearable TFT-LCD Driver Chip Market Forecast (USD Billion), by Sub-Segment 3, 2018-2029
Figure 79: Asia Pacific Smart Wearable TFT-LCD Driver Chip Market Forecast (USD Billion), by Others, 2018-2029
Figure 80: Asia Pacific Smart Wearable TFT-LCD Driver Chip Market Forecast (USD Billion), by China, 2018-2029
Figure 81: Asia Pacific Smart Wearable TFT-LCD Driver Chip Market Forecast (USD Billion), by India, 2018-2029
Figure 82: Asia Pacific Smart Wearable TFT-LCD Driver Chip Market Forecast (USD Billion), by Japan, 2018-2029
Figure 83: Asia Pacific Smart Wearable TFT-LCD Driver Chip Market Forecast (USD Billion), by Australia, 2018-2029
Figure 84: Asia Pacific Smart Wearable TFT-LCD Driver Chip Market Forecast (USD Billion), by Southeast Asia, 2018-2029
Figure 85: Asia Pacific Smart Wearable TFT-LCD Driver Chip Market Forecast (USD Billion), by Rest of Asia Pacific, 2018-2029
Figure 86: Middle East & Africa Smart Wearable TFT-LCD Driver Chip Market Value Share (%), By Segment 1, 2022 & 2029
Figure 87: Middle East & Africa Smart Wearable TFT-LCD Driver Chip Market Forecast (USD Billion), by Sub-Segment 1, 2018-2029
Figure 88: Middle East & Africa Smart Wearable TFT-LCD Driver Chip Market Forecast (USD Billion), by Sub-Segment 2, 2018-2029
Figure 89: Middle East & Africa Smart Wearable TFT-LCD Driver Chip Market Value Share (%), By Segment 2, 2022 & 2029
Figure 90: Middle East & Africa Smart Wearable TFT-LCD Driver Chip Market Forecast (USD Billion), by Sub-Segment 1, 2018-2029
Figure 91: Middle East & Africa Smart Wearable TFT-LCD Driver Chip Market Forecast (USD Billion), by Sub-Segment 2, 2018-2029
Figure 92: Middle East & Africa Smart Wearable TFT-LCD Driver Chip Market Forecast (USD Billion), by Sub-Segment 3, 2018-2029
Figure 93: Middle East & Africa Smart Wearable TFT-LCD Driver Chip Market Forecast (USD Billion), by Others, 2018-2029
Figure 94: Middle East & Africa Smart Wearable TFT-LCD Driver Chip Market Value Share (%), By Segment 3, 2022 & 2029
Figure 95: Middle East & Africa Smart Wearable TFT-LCD Driver Chip Market Forecast (USD Billion), by Sub-Segment 1, 2018-2029
Figure 96: Middle East & Africa Smart Wearable TFT-LCD Driver Chip Market Forecast (USD Billion), by Sub-Segment 2, 2018-2029
Figure 97: Middle East & Africa Smart Wearable TFT-LCD Driver Chip Market Forecast (USD Billion), by Sub-Segment 3, 2018-2029
Figure 98: Middle East & Africa Smart Wearable TFT-LCD Driver Chip Market Forecast (USD Billion), by Others, 2018-2029
Figure 99: Middle East & Africa Smart Wearable TFT-LCD Driver Chip Market Forecast (USD Billion), by GCC, 2018-2029
Figure 100: Middle East & Africa Smart Wearable TFT-LCD Driver Chip Market Forecast (USD Billion), by South Africa, 2018-2029
Figure 101: Middle East & Africa Smart Wearable TFT-LCD Driver Chip Market Forecast (USD Billion), by Rest of Middle East & Africa, 2018-2029
List of Tables
Table 1: Global Smart Wearable TFT-LCD Driver Chip Market Revenue (USD Billion) Forecast, by Segment 1, 2018-2029
Table 2: Global Smart Wearable TFT-LCD Driver Chip Market Revenue (USD Billion) Forecast, by Segment 2, 2018-2029
Table 3: Global Smart Wearable TFT-LCD Driver Chip Market Revenue (USD Billion) Forecast, by Segment 3, 2018-2029
Table 4: Global Smart Wearable TFT-LCD Driver Chip Market Revenue (USD Billion) Forecast, by Region, 2018-2029
Table 5: North America Smart Wearable TFT-LCD Driver Chip Market Revenue (USD Billion) Forecast, by Segment 1, 2018-2029
Table 6: North America Smart Wearable TFT-LCD Driver Chip Market Revenue (USD Billion) Forecast, by Segment 2, 2018-2029
Table 7: North America Smart Wearable TFT-LCD Driver Chip Market Revenue (USD Billion) Forecast, by Segment 3, 2018-2029
Table 8: North America Smart Wearable TFT-LCD Driver Chip Market Revenue (USD Billion) Forecast, by Country, 2018-2029
Table 9: Europe Smart Wearable TFT-LCD Driver Chip Market Revenue (USD Billion) Forecast, by Segment 1, 2018-2029
Table 10: Europe Smart Wearable TFT-LCD Driver Chip Market Revenue (USD Billion) Forecast, by Segment 2, 2018-2029
Table 11: Europe Smart Wearable TFT-LCD Driver Chip Market Revenue (USD Billion) Forecast, by Segment 3, 2018-2029
Table 12: Europe Smart Wearable TFT-LCD Driver Chip Market Revenue (USD Billion) Forecast, by Country, 2018-2029
Table 13: Latin America Smart Wearable TFT-LCD Driver Chip Market Revenue (USD Billion) Forecast, by Segment 1, 2018-2029
Table 14: Latin America Smart Wearable TFT-LCD Driver Chip Market Revenue (USD Billion) Forecast, by Segment 2, 2018-2029
Table 15: Latin America Smart Wearable TFT-LCD Driver Chip Market Revenue (USD Billion) Forecast, by Segment 3, 2018-2029
Table 16: Latin America Smart Wearable TFT-LCD Driver Chip Market Revenue (USD Billion) Forecast, by Country, 2018-2029
Table 17: Asia Pacific Smart Wearable TFT-LCD Driver Chip Market Revenue (USD Billion) Forecast, by Segment 1, 2018-2029
Table 18: Asia Pacific Smart Wearable TFT-LCD Driver Chip Market Revenue (USD Billion) Forecast, by Segment 2, 2018-2029
Table 19: Asia Pacific Smart Wearable TFT-LCD Driver Chip Market Revenue (USD Billion) Forecast, by Segment 3, 2018-2029
Table 20: Asia Pacific Smart Wearable TFT-LCD Driver Chip Market Revenue (USD Billion) Forecast, by Country, 2018-2029
Table 21: Middle East & Africa Smart Wearable TFT-LCD Driver Chip Market Revenue (USD Billion) Forecast, by Segment 1, 2018-2029
Table 22: Middle East & Africa Smart Wearable TFT-LCD Driver Chip Market Revenue (USD Billion) Forecast, by Segment 2, 2018-2029
Table 23: Middle East & Africa Smart Wearable TFT-LCD Driver Chip Market Revenue (USD Billion) Forecast, by Segment 3, 2018-2029
Table 24: Middle East & Africa Smart Wearable TFT-LCD Driver Chip Market Revenue (USD Billion) Forecast, by Country, 2018-2029
Research Process
Data Library Research are conducted by industry experts who offer insight on
industry structure, market segmentations technology assessment and competitive landscape (CL), and penetration, as well as on emerging trends. Their analysis is based on primary interviews (~ 80%) and secondary research (~ 20%) as well as years of professional expertise in their respective industries. Adding to this, by analysing historical trends and current market positions, our analysts predict where the market will be headed for the next five years. Furthermore, the varying trends of segment & categories geographically presented are also studied and the estimated based on the primary & secondary research.
In this particular report from the supply side Data Library Research has conducted primary surveys (interviews) with the key level executives (VP, CEO’s, Marketing Director, Business Development Manager
and SOFT) of the companies that active & prominent as well as the midsized organization
FIGURE 1: DLR RESEARH PROCESS
![research-methodology1]()
Primary Research
Extensive primary research was conducted to gain a deeper insight of the market and industry performance. The analysis is based on both primary and secondary research as well as years of professional expertise in the respective industries.
In addition to analysing current and historical trends, our analysts predict where the market is headed over the next five years.
It varies by segment for these categories geographically presented in the list of market tables. Speaking about this particular report we have conducted primary surveys (interviews) with the key level executives (VP, CEO’s, Marketing Director, Business Development Manager and many more) of the major players active in the market.
Secondary Research
Secondary research was mainly used to collect and identify information useful for the extensive, technical, market-oriented, and Friend’s study of the Global Extra Neutral Alcohol. It was also used to obtain key information about major players, market classification and segmentation according to the industry trends, geographical markets, and developments related to the market and technology perspectives. For this study, analysts have gathered information from various credible sources, such as annual reports, sec filings, journals, white papers, SOFT presentations, and company web sites.
Market Size Estimation
Both, top-down and bottom-up approaches were used to estimate and validate the size of the Global market and to estimate the size of various other dependent submarkets in the overall Extra Neutral Alcohol. The key players in the market were identified through secondary research and their market contributions in the respective geographies were determined through primary and secondary research.
Forecast Model
![research-methodology2]()