Vehicle 4D Imaging Millimeter Wave Radar Market Overview and Analysis
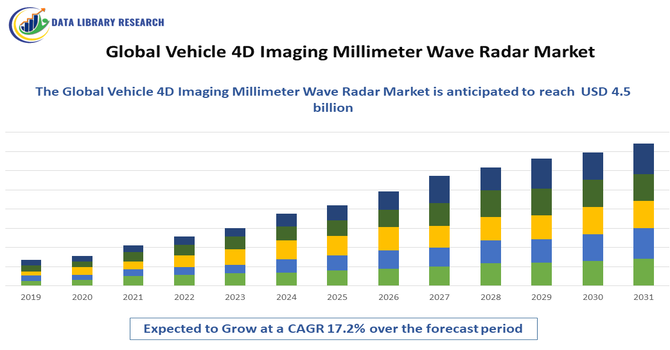
- The global Vehicle 4D Imaging Millimeter Wave Radar market, expected to grow from USD 1.76 billion in 2025 to USD 4.5 billion by 2032 at a CAGR of 17.2% from 2025-2032.
Get Complete Analysis Of The Report - Download Updated Free Sample PDF
The global Vehicle 4D Imaging Millimeter Wave Radar market involves advanced radar systems enabling precise environment perception, supporting autonomous driving, collision avoidance, and enhanced safety across modern vehicles through high-resolution, real-time object detection. The global Vehicle 4D Imaging Millimeter Wave Radar market is experiencing robust growth, primarily driven by the escalating demand for advanced driver-assistance systems (ADAS) and autonomous vehicles. These radar systems enhance vehicle safety by providing high-resolution, real-time environmental data, enabling features such as adaptive cruise control, collision avoidance, and lane-keeping assistance. Technological advancements, including the integration of Multiple Input Multiple Output (MIMO) radar and millimeter-wave (mmWave) technologies, have significantly improved the performance of 4D imaging radar systems, offering superior resolution and accuracy in object detection and environmental mapping.
Vehicle 4D Imaging Millimeter Wave Radar Market Latest Trends
The global Vehicle 4D Imaging Millimeter Wave Radar market is witnessing significant advancements, driven by several key trends. A notable development is the integration of radar fusion technology, which combines data from multiple sensors to enhance object detection and classification capabilities. This fusion approach improves the overall performance and reliability of advanced driver-assistance systems (ADAS) and autonomous vehicles. Additionally, the adoption of MIMO (Multiple Input Multiple Output) radar and millimeter-wave (mmWave) technologies has enhanced the resolution and accuracy of 4D imaging radar systems, enabling precise environmental mapping and object tracking. These technological advancements are propelling the market toward achieving higher levels of automation in the automotive industry.
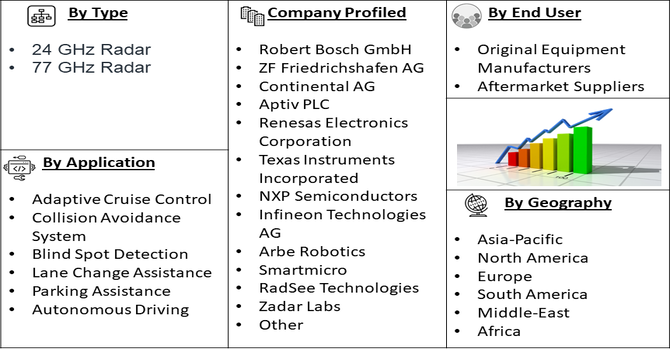
Segmentation: Global Vehicle 4D Imaging Millimetre Wave Rader Market By Product Type (24 GHz Radar, 77 GHz Radar), Application (Adaptive Cruise Control, Collision Avoidance System, Blind Spot Detection, Lane Change Assistance, Parking Assistance, Autonomous Driving), End-User (Original Equipment Manufacturers, Aftermarket Suppliers), and Geography (North America, Europe, Asia-Pacific, Middle East and Africa, and South America). The report provides the value (in USD million) for the above segments.
For Detailed Market Segmentation - Get a Free Sample PDF
Market Drivers:
- Rising Adoption of Advanced Driver-Assistance Systems (ADAS) and Autonomous Vehicles
The growing focus on vehicle safety and automation is a primary driver for the 4D imaging millimeter wave radar market. ADAS features such as adaptive cruise control, collision avoidance systems, lane-keeping assistance, and blind spot detection rely heavily on precise and real-time environmental sensing. As consumer awareness of vehicle safety increases and regulatory authorities enforce stricter safety standards, automotive manufacturers are integrating 4D imaging radar systems into both passenger and commercial vehicles. Additionally, the global push towards autonomous vehicles, which require high-resolution, reliable radar systems for real-time navigation and obstacle detection, is further accelerating market demand.
- Technological Advancements Enhancing Radar Capabilities
Continuous innovation in radar technology is driving market expansion. The adoption of Multiple Input Multiple Output (MIMO) radar, combined with millimeter-wave (mmWave) imaging, allows for higher spatial resolution, longer detection range, and accurate object tracking under various environmental conditions, including poor visibility and adverse weather. These technological enhancements enable 4D imaging radar systems to deliver superior performance in detecting and classifying objects, supporting advanced automotive safety features and autonomous driving functionalities. Furthermore, integration with AI and sensor fusion technologies improves overall system intelligence, reliability, and operational efficiency, creating significant growth opportunities in the automotive sector.
Market Restraints:
- High Cost of Radar Systems
The advanced technology and precision components used in 4D imaging millimeter wave radars make them expensive, which can limit adoption, especially in low-cost vehicle segments. For instance, the average price of radar system ranges between USD 1,800-USD 3,000. The significant reliance on advanced technology and precision components, such as high-frequency chipsets, complex antennae arrays, and robust electronic control units, makes 4D imaging millimeter wave radars inherently expensive. This high unit cost serves as a substantial barrier to mass market penetration, particularly for budget-friendly or entry-level vehicle models where cost efficiency is paramount. While this technology is crucial for high-end luxury and premium autonomous vehicles, the expense restricts its widespread integration across all vehicle segments, thereby limiting the overall market volume and slowing the global adoption of the technology.
Socio economic Impact on Vehicle 4D Imaging Millimeter Wave Radar Market
The socio-economic impact on the Global Vehicle 4D Imaging Millimeter Wave Radar Market has been significant, driven by rapid advancements in vehicle automation, safety regulations, and the global transition toward intelligent mobility. Rising disposable incomes and increasing consumer awareness of road safety have fueled demand for vehicles equipped with advanced driver-assistance systems (ADAS). Governments worldwide are supporting safer transportation ecosystems through strict safety mandates and incentives for connected and autonomous vehicles, stimulating radar technology adoption. Economically, the sector has created new opportunities for semiconductor manufacturing, software development, and system integration, boosting employment and innovation. Socially, 4D radar technology enhances driving safety, reduces accidents, and fosters public trust in autonomous systems, contributing to smarter and more sustainable transportation networks globally.
Segmental Analysis:
- 77 GHz Radar segment is expected to witness highest growth over the forecast period
The 77 GHz radar segment holds the largest share of the market due to its high resolution, long detection range, and superior performance in various environmental conditions. It is widely adopted in modern vehicles for advanced safety features and autonomous driving, providing precise object detection and improved reliability for driver-assistance systems. The dominance of the 77 GHz segment is further solidified by the global regulatory push to reallocate the 24 GHz frequency band, forcing manufacturers to adopt the 77-81 GHz band for new radar systems. This higher frequency enables a much wider bandwidth, which is the key to achieving the sub-meter range and velocity resolution necessary for high-level autonomous driving. Its smaller wavelength also permits smaller, more flexible sensor designs, allowing automakers to seamlessly integrate multiple units around the vehicle for full 360-degree coverage without compromising vehicle aesthetics.
- Collision Avoidance System segment is expected to witness highest growth over the forecast period
Collision avoidance systems are a major driver within the applications segment, as they leverage 4D imaging radar to detect obstacles and other vehicles in real time. This segment’s growth is fueled by increasing road safety regulations and rising consumer demand for vehicles equipped with proactive safety technologies, reducing accident risks and enhancing overall traffic safety.
- Original Equipment Manufacturers segment is expected to witness highest growth over the forecast period
OEMs dominate the end-user segment, integrating 4D imaging radar systems directly into new vehicle models. The growing focus on vehicle safety and automation drives OEMs to incorporate advanced radar technologies to meet regulatory requirements and consumer expectations, making them the primary contributors to market revenue. Another major factor contributing to the OEM segment's dominance is the inherent complexity and specialized testing required for safety-critical systems like 4D imaging radar. Automakers prefer to source these integrated solutions directly from Tier 1 suppliers to ensure quality, reliability, and seamless integration with the vehicle's electronic control unit (ECU) architecture. This vertical integration strategy by OEMs ensures compliance with stringent functional safety standards, cementing their role as the primary end-users and largest revenue source in the market.
- Asia Pacific region is expected to witness highest growth over the forecast period
The Asia-Pacific (APAC) region is projected to witness the highest growth rate in the Global Vehicle 4D Imaging Millimeter Wave Radar Market, driven primarily by its position as the world's largest automotive production base. Countries like China, Japan, and South Korea are aggressively adopting and investing in autonomous driving technologies and Advanced Driver-Assistance Systems (ADAS). Strong government support for intelligent transportation and electric vehicles (EVs), combined with a massive, rapidly expanding middle class demanding feature-rich, safer cars, accelerates the integration of high-resolution 4D radar into a broad spectrum of new vehicle models.
For instance, In September 2025, ET Auto reported that sales of electric vehicles (EVs) in South Korea had jumped nearly 50 percent from a year earlier during the first eight months of the year, driven by the release of new models. According to the Korea Automobile & Mobility Association (KAMA), EV sales reached 142,456 units, up from 95,988 units the previous year. EVs accounted for 12.7 percent of all new car registrations, an increase of 3.8 percentage points from the same period last year, 2024. The surge in South Korea’s EV sales is fueling demand for advanced safety and sensing technologies, including 4D imaging millimeter-wave radar, thereby driving market growth across the APAC region through increased adoption in ADAS and autonomous vehicle systems.
Moreover, the strong commitment from regional governments, particularly in China, to rapidly develop and deploy smart city infrastructure and autonomous mobility services is a central growth accelerator. This supportive regulatory and investment environment encourages both local and international companies to establish manufacturing and R&D facilities. Furthermore, the immense size of the APAC consumer market, driven by increasing affluence, translates into high volumes of vehicle sales, accelerating the deployment of advanced sensor technologies like 4D imaging radar far quicker than in more saturated Western markets.
| Report Matrics |
Details |
| Market Size Value |
USD 4.5 billion |
| Growth Rate |
CAGR of 17.2% |
| Forecast |
2026-2033 |
| Historical data |
2021-2024 |
| Base Year |
2025 |
| Report Coverage |
Forecasted revenue, company rating, competitive environment, growth drivers, and trends |
| Segment Coverage |
Type, Application, End-User, Geography |
| Regional Scope |
North America, Europe, Asia Pacific, Middle East |
| Customized scope |
Free customization of reports (With 3 months Analysis Support ) |
| To Learn More About This Report |
Request a Free Sample Copy |
Vehicle 4D Imaging Millimeter Wave Radar Market Competitive Landscape
The global Vehicle 4D Imaging Millimetre Wave Radar market is highly competitive, driven by rapid technological advancements and increasing demand for vehicle safety and autonomous driving solutions. Key players focus on innovation, strategic partnerships, and product development to strengthen their market position. The market is characterized by continuous R&D, sensor fusion integration, and expansion into emerging regions. Competitive dynamics are further influenced by regulatory standards and the growing adoption of advanced driver-assistance systems (ADAS) across vehicles worldwide.
Key Player:
- Robert Bosch GmbH
- ZF Friedrichshafen AG
- Continental AG
- Aptiv PLC
- Renesas Electronics Corporation
- Texas Instruments Incorporated
- NXP Semiconductors
- Infineon Technologies AG
- Arbe Robotics
- Smartmicro
- RadSee Technologies
- Zadar Labs
- Huawei Technologies Co., Ltd.
- Vayyar Imaging
- Uhnder Inc.
- Hella GmbH & Co. KGaA (FORVIA)
- Denso Corporation
- Valeo SA
- Analog Devices
- Mitsubishi Electric Corporation
-
Recent Development
- In December 2022, ZF initiated the first deployment of its advanced Imaging Radar technology—previously known as Full-Range Radar—to China’s SAIC Motor Corporation for its R-Series vehicles. The 4D radar perceived surroundings with discrete height information, enhancing safety and reliability for semi to fully automated (L4) driving. This launch marked a major advancement in the global 4D imaging millimeter-wave radar market, accelerating adoption, competition, and innovation while strengthening ZF’s position in the Asia-Pacific autonomous driving and ADAS technology landscape.
- In October 2022, Rohde & Schwarz enabled the launch of Cubtek’s 4D imaging radar platform with NXP, providing network analyzers and oscilloscopes for precise E-band RF measurements using proprietary ASICs. This collaboration enhanced radar accuracy and development efficiency, driving innovation, reliability, and competitiveness in the global 4D imaging millimeter-wave radar market, particularly for ADAS and autonomous driving applications.
Frequently Asked Questions (FAQ) :
Q1. What the main growth driving factors for this market?
The primary drivers are the worldwide push for Advanced Driver-Assistance Systems (ADAS) and the rapid development of high-level autonomous vehicles. Stricter global safety regulations, which mandate advanced collision avoidance and emergency braking features, necessitate the superior resolution of 4D imaging radar. Its ability to accurately detect and classify objects in poor weather (fog, heavy rain) is vital for reliable self-driving technology.
Q2. What are the main restraining factors for this market?
A significant hurdle is the high cost associated with the technology, including the complex development, manufacturing, and integration of 4D radar systems. These systems require numerous antenna channels and high-performance processors to handle massive data, making them less suitable for economy-class vehicles. Furthermore, the lack of universally accepted regulatory and frequency standardization across regions complicates mass-market deployment.
Q3. Which segment is expected to witness high growth?
The Autonomous Driving (Level 3 and above) application segment is poised for the highest growth. As the industry advances toward vehicles that can perform most driving tasks, 4D radar becomes a critical component. Its capability to provide high-resolution, four-dimensional data (including height) is essential for sophisticated environment perception and decision-making in complex driving scenarios.
Q4. Who are the top major players for this market?
The market is dominated by major Tier 1 automotive suppliers and specialized tech firms. Key players include industry giants like Continental AG, Robert Bosch GmbH, Aptiv PLC, Denso Corporation, and Valeo S.A. Dedicated imaging radar innovators such as Arbe Robotics and major chip suppliers like NXP Semiconductors are also essential contributors, focusing on higher resolution and cost reduction.
Q5. Which country is the largest player?
China (within the Asia-Pacific region) is consistently recognized as the largest and fastest-growing market for vehicle 4D imaging millimeter wave radar. This leadership is driven by its immense domestic automotive production, substantial government investment in smart transportation infrastructure, and the aggressive development and adoption of high-level autonomous and electric vehicles.
List of Figures
Figure 1: Global Vehicle 4D Imaging Millimeter Wave Radar Market Revenue Breakdown (USD Billion, %) by Region, 2022 & 2029
Figure 2: Global Vehicle 4D Imaging Millimeter Wave Radar Market Value Share (%), By Segment 1, 2022 & 2029
Figure 3: Global Vehicle 4D Imaging Millimeter Wave Radar Market Forecast (USD Billion), by Sub-Segment 1, 2018-2029
Figure 4: Global Vehicle 4D Imaging Millimeter Wave Radar Market Forecast (USD Billion), by Sub-Segment 2, 2018-2029
Figure 5: Global Vehicle 4D Imaging Millimeter Wave Radar Market Value Share (%), By Segment 2, 2022 & 2029
Figure 6: Global Vehicle 4D Imaging Millimeter Wave Radar Market Forecast (USD Billion), by Sub-Segment 1, 2018-2029
Figure 7: Global Vehicle 4D Imaging Millimeter Wave Radar Market Forecast (USD Billion), by Sub-Segment 2, 2018-2029
Figure 8: Global Vehicle 4D Imaging Millimeter Wave Radar Market Forecast (USD Billion), by Sub-Segment 3, 2018-2029
Figure 9: Global Vehicle 4D Imaging Millimeter Wave Radar Market Forecast (USD Billion), by Others, 2018-2029
Figure 10: Global Vehicle 4D Imaging Millimeter Wave Radar Market Value Share (%), By Segment 3, 2022 & 2029
Figure 11: Global Vehicle 4D Imaging Millimeter Wave Radar Market Forecast (USD Billion), by Sub-Segment 1, 2018-2029
Figure 12: Global Vehicle 4D Imaging Millimeter Wave Radar Market Forecast (USD Billion), by Sub-Segment 2, 2018-2029
Figure 13: Global Vehicle 4D Imaging Millimeter Wave Radar Market Forecast (USD Billion), by Sub-Segment 3, 2018-2029
Figure 14: Global Vehicle 4D Imaging Millimeter Wave Radar Market Forecast (USD Billion), by Others, 2018-2029
Figure 15: Global Vehicle 4D Imaging Millimeter Wave Radar Market Value (USD Billion), by Region, 2022 & 2029
Figure 16: North America Vehicle 4D Imaging Millimeter Wave Radar Market Value Share (%), By Segment 1, 2022 & 2029
Figure 17: North America Vehicle 4D Imaging Millimeter Wave Radar Market Forecast (USD Billion), by Sub-Segment 1, 2018-2029
Figure 18: North America Vehicle 4D Imaging Millimeter Wave Radar Market Forecast (USD Billion), by Sub-Segment 2, 2018-2029
Figure 19: North America Vehicle 4D Imaging Millimeter Wave Radar Market Value Share (%), By Segment 2, 2022 & 2029
Figure 20: North America Vehicle 4D Imaging Millimeter Wave Radar Market Forecast (USD Billion), by Sub-Segment 1, 2018-2029
Figure 21: North America Vehicle 4D Imaging Millimeter Wave Radar Market Forecast (USD Billion), by Sub-Segment 2, 2018-2029
Figure 22: North America Vehicle 4D Imaging Millimeter Wave Radar Market Forecast (USD Billion), by Sub-Segment 3, 2018-2029
Figure 23: North America Vehicle 4D Imaging Millimeter Wave Radar Market Forecast (USD Billion), by Others, 2018-2029
Figure 24: North America Vehicle 4D Imaging Millimeter Wave Radar Market Value Share (%), By Segment 3, 2022 & 2029
Figure 25: North America Vehicle 4D Imaging Millimeter Wave Radar Market Forecast (USD Billion), by Sub-Segment 1, 2018-2029
Figure 26: North America Vehicle 4D Imaging Millimeter Wave Radar Market Forecast (USD Billion), by Sub-Segment 2, 2018-2029
Figure 27: North America Vehicle 4D Imaging Millimeter Wave Radar Market Forecast (USD Billion), by Sub-Segment 3, 2018-2029
Figure 28: North America Vehicle 4D Imaging Millimeter Wave Radar Market Forecast (USD Billion), by Others, 2018-2029
Figure 29: North America Vehicle 4D Imaging Millimeter Wave Radar Market Forecast (USD Billion), by U.S., 2018-2029
Figure 30: North America Vehicle 4D Imaging Millimeter Wave Radar Market Forecast (USD Billion), by Canada, 2018-2029
Figure 31: Latin America Vehicle 4D Imaging Millimeter Wave Radar Market Value Share (%), By Segment 1, 2022 & 2029
Figure 32: Latin America Vehicle 4D Imaging Millimeter Wave Radar Market Forecast (USD Billion), by Sub-Segment 1, 2018-2029
Figure 33: Latin America Vehicle 4D Imaging Millimeter Wave Radar Market Forecast (USD Billion), by Sub-Segment 2, 2018-2029
Figure 34: Latin America Vehicle 4D Imaging Millimeter Wave Radar Market Value Share (%), By Segment 2, 2022 & 2029
Figure 35: Latin America Vehicle 4D Imaging Millimeter Wave Radar Market Forecast (USD Billion), by Sub-Segment 1, 2018-2029
Figure 36: Latin America Vehicle 4D Imaging Millimeter Wave Radar Market Forecast (USD Billion), by Sub-Segment 2, 2018-2029
Figure 37: Latin America Vehicle 4D Imaging Millimeter Wave Radar Market Forecast (USD Billion), by Sub-Segment 3, 2018-2029
Figure 38: Latin America Vehicle 4D Imaging Millimeter Wave Radar Market Forecast (USD Billion), by Others, 2018-2029
Figure 39: Latin America Vehicle 4D Imaging Millimeter Wave Radar Market Value Share (%), By Segment 3, 2022 & 2029
Figure 40: Latin America Vehicle 4D Imaging Millimeter Wave Radar Market Forecast (USD Billion), by Sub-Segment 1, 2018-2029
Figure 41: Latin America Vehicle 4D Imaging Millimeter Wave Radar Market Forecast (USD Billion), by Sub-Segment 2, 2018-2029
Figure 42: Latin America Vehicle 4D Imaging Millimeter Wave Radar Market Forecast (USD Billion), by Sub-Segment 3, 2018-2029
Figure 43: Latin America Vehicle 4D Imaging Millimeter Wave Radar Market Forecast (USD Billion), by Others, 2018-2029
Figure 44: Latin America Vehicle 4D Imaging Millimeter Wave Radar Market Forecast (USD Billion), by Brazil, 2018-2029
Figure 45: Latin America Vehicle 4D Imaging Millimeter Wave Radar Market Forecast (USD Billion), by Mexico, 2018-2029
Figure 46: Latin America Vehicle 4D Imaging Millimeter Wave Radar Market Forecast (USD Billion), by Rest of Latin America, 2018-2029
Figure 47: Europe Vehicle 4D Imaging Millimeter Wave Radar Market Value Share (%), By Segment 1, 2022 & 2029
Figure 48: Europe Vehicle 4D Imaging Millimeter Wave Radar Market Forecast (USD Billion), by Sub-Segment 1, 2018-2029
Figure 49: Europe Vehicle 4D Imaging Millimeter Wave Radar Market Forecast (USD Billion), by Sub-Segment 2, 2018-2029
Figure 50: Europe Vehicle 4D Imaging Millimeter Wave Radar Market Value Share (%), By Segment 2, 2022 & 2029
Figure 51: Europe Vehicle 4D Imaging Millimeter Wave Radar Market Forecast (USD Billion), by Sub-Segment 1, 2018-2029
Figure 52: Europe Vehicle 4D Imaging Millimeter Wave Radar Market Forecast (USD Billion), by Sub-Segment 2, 2018-2029
Figure 53: Europe Vehicle 4D Imaging Millimeter Wave Radar Market Forecast (USD Billion), by Sub-Segment 3, 2018-2029
Figure 54: Europe Vehicle 4D Imaging Millimeter Wave Radar Market Forecast (USD Billion), by Others, 2018-2029
Figure 55: Europe Vehicle 4D Imaging Millimeter Wave Radar Market Value Share (%), By Segment 3, 2022 & 2029
Figure 56: Europe Vehicle 4D Imaging Millimeter Wave Radar Market Forecast (USD Billion), by Sub-Segment 1, 2018-2029
Figure 57: Europe Vehicle 4D Imaging Millimeter Wave Radar Market Forecast (USD Billion), by Sub-Segment 2, 2018-2029
Figure 58: Europe Vehicle 4D Imaging Millimeter Wave Radar Market Forecast (USD Billion), by Sub-Segment 3, 2018-2029
Figure 59: Europe Vehicle 4D Imaging Millimeter Wave Radar Market Forecast (USD Billion), by Others, 2018-2029
Figure 60: Europe Vehicle 4D Imaging Millimeter Wave Radar Market Forecast (USD Billion), by U.K., 2018-2029
Figure 61: Europe Vehicle 4D Imaging Millimeter Wave Radar Market Forecast (USD Billion), by Germany, 2018-2029
Figure 62: Europe Vehicle 4D Imaging Millimeter Wave Radar Market Forecast (USD Billion), by France, 2018-2029
Figure 63: Europe Vehicle 4D Imaging Millimeter Wave Radar Market Forecast (USD Billion), by Italy, 2018-2029
Figure 64: Europe Vehicle 4D Imaging Millimeter Wave Radar Market Forecast (USD Billion), by Spain, 2018-2029
Figure 65: Europe Vehicle 4D Imaging Millimeter Wave Radar Market Forecast (USD Billion), by Russia, 2018-2029
Figure 66: Europe Vehicle 4D Imaging Millimeter Wave Radar Market Forecast (USD Billion), by Rest of Europe, 2018-2029
Figure 67: Asia Pacific Vehicle 4D Imaging Millimeter Wave Radar Market Value Share (%), By Segment 1, 2022 & 2029
Figure 68: Asia Pacific Vehicle 4D Imaging Millimeter Wave Radar Market Forecast (USD Billion), by Sub-Segment 1, 2018-2029
Figure 69: Asia Pacific Vehicle 4D Imaging Millimeter Wave Radar Market Forecast (USD Billion), by Sub-Segment 2, 2018-2029
Figure 70: Asia Pacific Vehicle 4D Imaging Millimeter Wave Radar Market Value Share (%), By Segment 2, 2022 & 2029
Figure 71: Asia Pacific Vehicle 4D Imaging Millimeter Wave Radar Market Forecast (USD Billion), by Sub-Segment 1, 2018-2029
Figure 72: Asia Pacific Vehicle 4D Imaging Millimeter Wave Radar Market Forecast (USD Billion), by Sub-Segment 2, 2018-2029
Figure 73: Asia Pacific Vehicle 4D Imaging Millimeter Wave Radar Market Forecast (USD Billion), by Sub-Segment 3, 2018-2029
Figure 74: Asia Pacific Vehicle 4D Imaging Millimeter Wave Radar Market Forecast (USD Billion), by Others, 2018-2029
Figure 75: Asia Pacific Vehicle 4D Imaging Millimeter Wave Radar Market Value Share (%), By Segment 3, 2022 & 2029
Figure 76: Asia Pacific Vehicle 4D Imaging Millimeter Wave Radar Market Forecast (USD Billion), by Sub-Segment 1, 2018-2029
Figure 77: Asia Pacific Vehicle 4D Imaging Millimeter Wave Radar Market Forecast (USD Billion), by Sub-Segment 2, 2018-2029
Figure 78: Asia Pacific Vehicle 4D Imaging Millimeter Wave Radar Market Forecast (USD Billion), by Sub-Segment 3, 2018-2029
Figure 79: Asia Pacific Vehicle 4D Imaging Millimeter Wave Radar Market Forecast (USD Billion), by Others, 2018-2029
Figure 80: Asia Pacific Vehicle 4D Imaging Millimeter Wave Radar Market Forecast (USD Billion), by China, 2018-2029
Figure 81: Asia Pacific Vehicle 4D Imaging Millimeter Wave Radar Market Forecast (USD Billion), by India, 2018-2029
Figure 82: Asia Pacific Vehicle 4D Imaging Millimeter Wave Radar Market Forecast (USD Billion), by Japan, 2018-2029
Figure 83: Asia Pacific Vehicle 4D Imaging Millimeter Wave Radar Market Forecast (USD Billion), by Australia, 2018-2029
Figure 84: Asia Pacific Vehicle 4D Imaging Millimeter Wave Radar Market Forecast (USD Billion), by Southeast Asia, 2018-2029
Figure 85: Asia Pacific Vehicle 4D Imaging Millimeter Wave Radar Market Forecast (USD Billion), by Rest of Asia Pacific, 2018-2029
Figure 86: Middle East & Africa Vehicle 4D Imaging Millimeter Wave Radar Market Value Share (%), By Segment 1, 2022 & 2029
Figure 87: Middle East & Africa Vehicle 4D Imaging Millimeter Wave Radar Market Forecast (USD Billion), by Sub-Segment 1, 2018-2029
Figure 88: Middle East & Africa Vehicle 4D Imaging Millimeter Wave Radar Market Forecast (USD Billion), by Sub-Segment 2, 2018-2029
Figure 89: Middle East & Africa Vehicle 4D Imaging Millimeter Wave Radar Market Value Share (%), By Segment 2, 2022 & 2029
Figure 90: Middle East & Africa Vehicle 4D Imaging Millimeter Wave Radar Market Forecast (USD Billion), by Sub-Segment 1, 2018-2029
Figure 91: Middle East & Africa Vehicle 4D Imaging Millimeter Wave Radar Market Forecast (USD Billion), by Sub-Segment 2, 2018-2029
Figure 92: Middle East & Africa Vehicle 4D Imaging Millimeter Wave Radar Market Forecast (USD Billion), by Sub-Segment 3, 2018-2029
Figure 93: Middle East & Africa Vehicle 4D Imaging Millimeter Wave Radar Market Forecast (USD Billion), by Others, 2018-2029
Figure 94: Middle East & Africa Vehicle 4D Imaging Millimeter Wave Radar Market Value Share (%), By Segment 3, 2022 & 2029
Figure 95: Middle East & Africa Vehicle 4D Imaging Millimeter Wave Radar Market Forecast (USD Billion), by Sub-Segment 1, 2018-2029
Figure 96: Middle East & Africa Vehicle 4D Imaging Millimeter Wave Radar Market Forecast (USD Billion), by Sub-Segment 2, 2018-2029
Figure 97: Middle East & Africa Vehicle 4D Imaging Millimeter Wave Radar Market Forecast (USD Billion), by Sub-Segment 3, 2018-2029
Figure 98: Middle East & Africa Vehicle 4D Imaging Millimeter Wave Radar Market Forecast (USD Billion), by Others, 2018-2029
Figure 99: Middle East & Africa Vehicle 4D Imaging Millimeter Wave Radar Market Forecast (USD Billion), by GCC, 2018-2029
Figure 100: Middle East & Africa Vehicle 4D Imaging Millimeter Wave Radar Market Forecast (USD Billion), by South Africa, 2018-2029
Figure 101: Middle East & Africa Vehicle 4D Imaging Millimeter Wave Radar Market Forecast (USD Billion), by Rest of Middle East & Africa, 2018-2029
List of Tables
Table 1: Global Vehicle 4D Imaging Millimeter Wave Radar Market Revenue (USD Billion) Forecast, by Segment 1, 2018-2029
Table 2: Global Vehicle 4D Imaging Millimeter Wave Radar Market Revenue (USD Billion) Forecast, by Segment 2, 2018-2029
Table 3: Global Vehicle 4D Imaging Millimeter Wave Radar Market Revenue (USD Billion) Forecast, by Segment 3, 2018-2029
Table 4: Global Vehicle 4D Imaging Millimeter Wave Radar Market Revenue (USD Billion) Forecast, by Region, 2018-2029
Table 5: North America Vehicle 4D Imaging Millimeter Wave Radar Market Revenue (USD Billion) Forecast, by Segment 1, 2018-2029
Table 6: North America Vehicle 4D Imaging Millimeter Wave Radar Market Revenue (USD Billion) Forecast, by Segment 2, 2018-2029
Table 7: North America Vehicle 4D Imaging Millimeter Wave Radar Market Revenue (USD Billion) Forecast, by Segment 3, 2018-2029
Table 8: North America Vehicle 4D Imaging Millimeter Wave Radar Market Revenue (USD Billion) Forecast, by Country, 2018-2029
Table 9: Europe Vehicle 4D Imaging Millimeter Wave Radar Market Revenue (USD Billion) Forecast, by Segment 1, 2018-2029
Table 10: Europe Vehicle 4D Imaging Millimeter Wave Radar Market Revenue (USD Billion) Forecast, by Segment 2, 2018-2029
Table 11: Europe Vehicle 4D Imaging Millimeter Wave Radar Market Revenue (USD Billion) Forecast, by Segment 3, 2018-2029
Table 12: Europe Vehicle 4D Imaging Millimeter Wave Radar Market Revenue (USD Billion) Forecast, by Country, 2018-2029
Table 13: Latin America Vehicle 4D Imaging Millimeter Wave Radar Market Revenue (USD Billion) Forecast, by Segment 1, 2018-2029
Table 14: Latin America Vehicle 4D Imaging Millimeter Wave Radar Market Revenue (USD Billion) Forecast, by Segment 2, 2018-2029
Table 15: Latin America Vehicle 4D Imaging Millimeter Wave Radar Market Revenue (USD Billion) Forecast, by Segment 3, 2018-2029
Table 16: Latin America Vehicle 4D Imaging Millimeter Wave Radar Market Revenue (USD Billion) Forecast, by Country, 2018-2029
Table 17: Asia Pacific Vehicle 4D Imaging Millimeter Wave Radar Market Revenue (USD Billion) Forecast, by Segment 1, 2018-2029
Table 18: Asia Pacific Vehicle 4D Imaging Millimeter Wave Radar Market Revenue (USD Billion) Forecast, by Segment 2, 2018-2029
Table 19: Asia Pacific Vehicle 4D Imaging Millimeter Wave Radar Market Revenue (USD Billion) Forecast, by Segment 3, 2018-2029
Table 20: Asia Pacific Vehicle 4D Imaging Millimeter Wave Radar Market Revenue (USD Billion) Forecast, by Country, 2018-2029
Table 21: Middle East & Africa Vehicle 4D Imaging Millimeter Wave Radar Market Revenue (USD Billion) Forecast, by Segment 1, 2018-2029
Table 22: Middle East & Africa Vehicle 4D Imaging Millimeter Wave Radar Market Revenue (USD Billion) Forecast, by Segment 2, 2018-2029
Table 23: Middle East & Africa Vehicle 4D Imaging Millimeter Wave Radar Market Revenue (USD Billion) Forecast, by Segment 3, 2018-2029
Table 24: Middle East & Africa Vehicle 4D Imaging Millimeter Wave Radar Market Revenue (USD Billion) Forecast, by Country, 2018-2029
Research Process
Data Library Research are conducted by industry experts who offer insight on
industry structure, market segmentations technology assessment and competitive landscape (CL), and penetration, as well as on emerging trends. Their analysis is based on primary interviews (~ 80%) and secondary research (~ 20%) as well as years of professional expertise in their respective industries. Adding to this, by analysing historical trends and current market positions, our analysts predict where the market will be headed for the next five years. Furthermore, the varying trends of segment & categories geographically presented are also studied and the estimated based on the primary & secondary research.
In this particular report from the supply side Data Library Research has conducted primary surveys (interviews) with the key level executives (VP, CEO’s, Marketing Director, Business Development Manager
and SOFT) of the companies that active & prominent as well as the midsized organization
FIGURE 1: DLR RESEARH PROCESS
![research-methodology1]()
Primary Research
Extensive primary research was conducted to gain a deeper insight of the market and industry performance. The analysis is based on both primary and secondary research as well as years of professional expertise in the respective industries.
In addition to analysing current and historical trends, our analysts predict where the market is headed over the next five years.
It varies by segment for these categories geographically presented in the list of market tables. Speaking about this particular report we have conducted primary surveys (interviews) with the key level executives (VP, CEO’s, Marketing Director, Business Development Manager and many more) of the major players active in the market.
Secondary Research
Secondary research was mainly used to collect and identify information useful for the extensive, technical, market-oriented, and Friend’s study of the Global Extra Neutral Alcohol. It was also used to obtain key information about major players, market classification and segmentation according to the industry trends, geographical markets, and developments related to the market and technology perspectives. For this study, analysts have gathered information from various credible sources, such as annual reports, sec filings, journals, white papers, SOFT presentations, and company web sites.
Market Size Estimation
Both, top-down and bottom-up approaches were used to estimate and validate the size of the Global market and to estimate the size of various other dependent submarkets in the overall Extra Neutral Alcohol. The key players in the market were identified through secondary research and their market contributions in the respective geographies were determined through primary and secondary research.
Forecast Model
![research-methodology2]()