Automated Cell Cultures Market Overview and Analysis

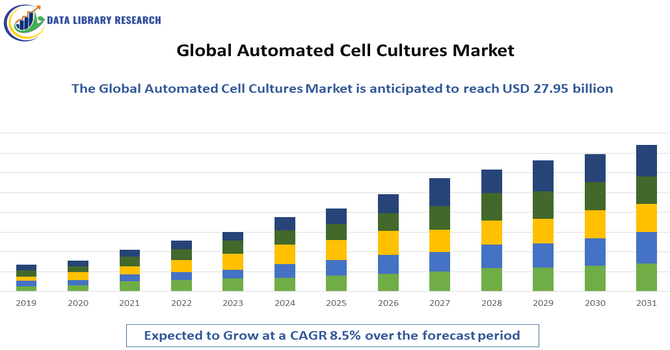
The Global Automated Cell Cultures Market was valued at USD 14.13 billion in 2026 and is expected to reach USD 27.95 billion by 2033, growing at a CAGR of 8.5% from 2026-2033.

Automated Cell Cultures Market

Get Complete Analysis Of The Report - Download Updated Free Sample PDF
 

The Global Automated Cell Cultures Market refers to the industry focused on developing and providing automated systems and technologies for culturing cells in laboratories and biomanufacturing. These systems streamline cell growth, monitoring, and maintenance, reducing manual labor and minimizing contamination risks. Automated cell culture solutions enhance reproducibility, scalability, and efficiency in research, drug development, regenerative medicine, and biopharmaceutical production. Growth in this market is driven by increasing demand for advanced cell therapies, rising investments in biotechnology, and the need for high-throughput screening and personalized medicine.

Automated Cell Cultures Market Latest Trends

The Global Automated Cell Cultures Market is driven by rising adoption of automation in research and biomanufacturing to improve efficiency, scalability, and reproducibility. Advances in robotic systems, bioreactors, and AI-enabled monitoring tools are enabling precise control over cell growth and differentiation. High-throughput screening, personalized medicine, and regenerative therapies are increasingly relying on automated systems to reduce contamination risks and labor costs. Integration with digital platforms and data analytics supports real-time monitoring and process optimization.

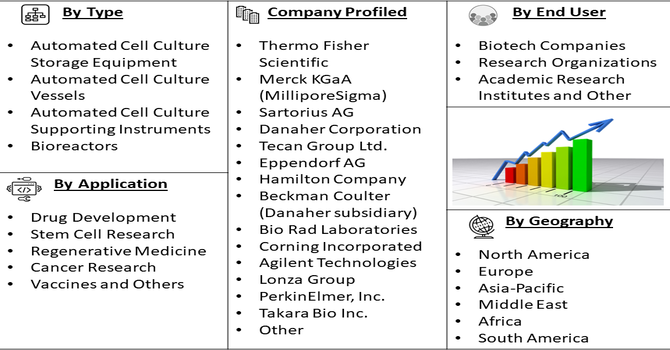
Segmentation: The Global Automated Cell Cultures Market is segmented by Products (Instruments, Reagents and Kits, and Others), Type (Automated Cell Culture Storage Equipment, Automated Cell Culture Vessels, Automated Cell Culture Supporting Instruments, Bioreactors), Application (Drug Development, Stem Cell Research, Regenerative Medicine, Cancer Research, Vaccines, and Others), End User (Biotech Companies, Research Organizations, Academic Research Institutes, and Other) and Geography (North America, Europe, Asia-Pacific, Middle East and Africa, and South America). The report provides the value (in USD million) for the above segments.

Automated Cell Cultures Market segment

For Detailed Market Segmentation - Get a Free Sample PDF

Market Drivers:

  • Increasing Demand for Cell-Based Therapies and Regenerative Medicine

The growing demand for cell-based therapies, including stem cell treatments, CAR-T therapies, and regenerative medicine, is a primary driver for the automated cell cultures market. Traditional manual cell culture methods are labor-intensive, prone to contamination, and limited in scalability. Automated systems provide standardized, reproducible conditions, enabling the production of large volumes of high-quality cells for clinical and research applications. As the biotechnology and pharmaceutical industries expand their pipelines for personalized therapies and advanced biologics, the need for reliable, scalable, and precise automated cell culture solutions continues to accelerate globally.

  • Technological Advancements and High-Throughput Automation

Rapid technological advancements, such as robotic arms, automated bioreactors, AI-enabled monitoring, and real-time analytics, are driving market growth. High-throughput automated systems allow simultaneous cultivation of multiple cell lines under controlled conditions, improving efficiency, reducing human error, and enhancing reproducibility.

In May 2024, SINFONIA TECHNOLOGY delivered CellQualia ICP systems to Keio University, completing performance qualification in April. These systems enhanced technological advancements and high-throughput automation by enabling stable, efficient production of high-quality cell medicines, while supporting automated storage and streamlined handling in regenerative medicine applications. Integration with laboratory information management systems (LIMS) and cloud-based analytics supports data-driven process optimization and quality control. Pharmaceutical companies, academic institutions, and contract research organizations increasingly adopt these technologies to accelerate drug discovery, toxicity testing, and vaccine development, further boosting demand for automated cell culture solutions worldwide.

Market Restraints:

  • High Capital Investment and Maintenance Costs

A significant restraint for the automated cell culture market is the high initial capital investment and ongoing maintenance costs associated with these systems. Advanced bioreactors, robotic platforms, and monitoring software require substantial funding, making adoption challenging for small laboratories and emerging biotech companies. Additionally, maintenance, calibration, and specialized training for personnel add to operational expenses. Budget constraints can delay deployment and limit scalability in certain regions. Regulatory compliance, validation, and integration with existing laboratory infrastructure further increase costs, restraining widespread adoption despite the efficiency, reproducibility, and quality benefits offered by automated cell culture technologies.

Socioeconomic Impact on Automated Cell Cultures Market

Automated cell culture technologies have significant socioeconomic benefits by accelerating drug development, supporting regenerative medicine, and improving healthcare outcomes. They reduce labor intensity and contamination risks, lowering research and production costs, which enhances the affordability of therapies. Increased efficiency in biopharmaceutical manufacturing leads to faster delivery of treatments to patients, contributing to public health improvements. Additionally, automation stimulates job creation in high-skill roles such as bioinformatics, robotics maintenance, and process engineering, while upskilling the workforce. Widespread adoption in research institutions and hospitals helps bridge healthcare gaps, making advanced therapies and diagnostics more accessible and improving quality of life globally.

Segmental Analysis:

  • Reagents and Kits segment is expected to witness highest growth over the forecast period

The reagents and kits segment is expected to witness the highest growth over the forecast period due to rising demand for standardized, ready-to-use solutions that simplify automated cell culture processes. These products reduce manual preparation, minimize contamination risk, and ensure consistent cell growth and quality. Pharmaceutical, biotechnology, and academic research laboratories increasingly rely on pre-formulated reagents, growth media, and assay kits to accelerate experimentation and therapeutic development. Integration with automated platforms further enhances throughput and reproducibility. As cell-based research and regenerative medicine expand, the demand for high-quality, reliable reagents and kits is projected to drive significant market growth globally.

  • Automated Cell Culture Storage Equipment segment is expected to witness highest growth over the forecast period

The automated cell culture storage equipment segment is expected to grow rapidly, driven by the need for secure, scalable, and temperature-controlled storage of cell lines and cultures. Biorepositories, research laboratories, and biopharmaceutical companies require automated storage systems that integrate with cell culture platforms to preserve cell viability, reduce human error, and streamline retrieval. Advanced systems offer real-time monitoring, alarm notifications, and data logging to ensure compliance with regulatory standards. The growth of stem cell therapies, regenerative medicine, and biopharmaceutical production is further accelerating the adoption of automated storage solutions, making this segment a key contributor to overall market expansion.

  • Drug Development segment is expected to witness highest growth over the forecast period

The drug development segment is expected to witness the highest growth, driven by increasing demand for high-throughput, reproducible, and scalable cell culture systems in pharmaceutical research. Automated cell cultures enable efficient screening of compounds, toxicity testing, and preclinical validation, significantly reducing development timelines. Integration with AI, machine learning, and predictive analytics enhances decision-making and accelerates the identification of promising drug candidates. As pharmaceutical companies invest in biologics, vaccines, and personalized medicines, automated cell culture platforms play a crucial role in reducing costs, improving productivity, and ensuring consistent quality, positioning the drug development segment as a key growth driver.

  • Biotech Companies segment is expected to witness highest growth over the forecast period

The biotech companies segment is projected to experience the highest growth over the forecast period, driven by increased research and therapeutic development activities. Biotech firms are leveraging automated cell culture systems to accelerate drug discovery, regenerative medicine, and cell therapy manufacturing. Automation ensures reproducibility, scalability, and compliance with regulatory standards, enabling companies to meet growing demand for biologics and personalized therapies. Rising investment in biotechnology, coupled with the expansion of contract research and manufacturing services, has further fueled adoption. As biotech companies seek cost-effective, high-throughput solutions, automated cell culture technologies have become central to innovation and market competitiveness.

  • North America Region is expected to witness highest growth over the forecast period

North America is expected to witness the highest growth over the forecast period, supported by advanced R&D infrastructure, early adoption of automation technologies, and substantial investments in biotechnology and pharmaceuticals.

The U.S. and Canada lead in cell therapy, regenerative medicine, and biologics production, creating strong demand for automated cell culture platforms. For instance, in 2025, BD and Opentrons Labworks announced a multi-year collaboration to integrate robotic liquid-handling into BD’s single-cell multiomics instruments. This partnership automated critical experimental steps, enhancing efficiency and scalability in disease research and drug development. It positively impacted North America’s Automated Cell Cultures Market by driving adoption of high-throughput, automated systems and accelerating advancements in cell-based research and therapeutic development.

Regulatory support, availability of skilled workforce, and integration with AI, robotics, and cloud-based monitoring systems further drive adoption. Increasing collaborations between academic institutions, biotech firms, and pharmaceutical companies enhance innovation. As a result, North America remains a dominant and rapidly growing region for automated cell culture solutions, reflecting robust market potential and technological leadership.

Automated Cell Cultures Market table

To Learn More About This Report - Request a Free Sample Copy

Automated Cell Cultures Market Competitive Landscape

The competitive landscape of the Global Automated Cell Cultures Market is highly dynamic, with established biotechnology firms, laboratory equipment manufacturers, and emerging startups competing on innovation, efficiency, and system integration. Major players focus on developing robotic platforms, automated bioreactors, and software for real-time monitoring and process control. Strategic collaborations, acquisitions, and partnerships are common to expand product portfolios, enter new geographic markets, and integrate AI and IoT capabilities. Companies differentiate through scalability, customization, ease of use, and compliance with regulatory standards. Continuous R&D investment and technological innovation are key to gaining a competitive edge and meeting growing demand in research and biomanufacturing sectors.

The major players for above market are:

  • Thermo Fisher Scientific
  • Merck KGaA (MilliporeSigma)
  • Sartorius AG
  • Danaher Corporation
  • Tecan Group Ltd.
  • Eppendorf AG
  • Hamilton Company
  • Beckman Coulter (Danaher subsidiary)
  • Bio Rad Laboratories
  • Corning Incorporated
  • Agilent Technologies
  • GE Healthcare Life Sciences (Cytiva)
  • Lonza Group
  • PerkinElmer, Inc.
  • Takara Bio Inc.
  • Cell Culture Company GmbH
  • PBS Biotech
  • Applikon Biotechnology (a division of Getinge)
  • ATMI Life Sciences
  • Miltenyi Biotech

Recent Development

  • In May 2024, ProPharma, in collaboration with PBL, developed the Cell Manufacturing Box (CF Box), a fully enclosed, automated cell manufacturing system. The CF Box enables decentralized production of various cell and gene therapies (CAGT) in Class D (ISO8) or comparable controlled environments, marking a major technological advancement in cell therapy manufacturing.


  • In January 2024, Thermo Fisher Scientific launched Gibco Cell Therapy Systems (CTS™) Cellmation Software, an innovative automation solution that integrates workflows across multiple Thermo Fisher cell therapy instruments. Designed for cGMP compliance, the software optimizes clinical manufacturing processes, enhancing efficiency for developers of advanced cell and gene therapies.


Frequently Asked Questions (FAQ) :

Q1. What are the main growth-driving factors for this market?

The market is driven by the rising demand for biopharmaceuticals and monoclonal antibodies, which require precise, large-scale cell production. Automation minimizes human error and contamination risks, ensuring high-quality yields. Additionally, increased funding for regenerative medicine and the move toward high-throughput screening in drug discovery are significantly boosting adoption rates.

Q2. What are the main restraining factors for this market?

High capital investment for automated systems and specialized infrastructure remains a primary barrier, particularly for smaller research labs. The complexity of integrating automation with existing workflows and the need for highly skilled personnel to operate these systems also slow market expansion. Furthermore, stringent regulatory approval processes can delay product launches.

Q3. Which segment is expected to witness high growth?

The Automated Cell Culture Storage Equipment segment grew due to rising demand for secure, scalable, and temperature-controlled storage solutions. Integration with automated platforms ensured cell viability, reduced human error, and streamlined retrieval. Expansion in stem cell therapies, regenerative medicine, and biopharmaceutical production further accelerated adoption, driving market growth globally.

Q4. Who are the top major players for this market?

Key industry leaders include Thermo Fisher Scientific, Danaher Corporation (through Beckman Coulter and Cytiva), Sartorius AG, and Merck KGaA. Other significant players like Lonza, Eppendorf, and Tecan Group contribute through innovative robotic platforms and bioreactor technologies. these companies focus on strategic acquisitions and R&D to maintain their competitive edge.

Q5. Which country is the largest player?

The United States is the largest player in the global market, fueled by a robust biotechnology sector and extensive pharmaceutical R&D spending. The presence of major industry players, coupled with advanced healthcare infrastructure and favorable government initiatives for stem cell research, ensures its continued dominance in the automated cell culture landscape.

Automated Cell Cultures MARKET STUDY GLOBAL MARKET ANALYSIS, INSIGHTS AND FORECAST, 2022-2029

    1. Introduction

    • 1.1. Research Scope
    • 1.2. Market Segmentation
    • 1.3. Research Methodology
    • 1.4. Definitions and Assumptions

    2. Executive Summary

      3. Market Dynamics

      • 3.1. Market Drivers
      • 3.2. Market Restraints
      • 3.3. Market Opportunities

      4. Key Insights

      • 4.1. Key Emerging Trends – For Major Countries
      • 4.2. Latest Technological Advancement
      • 4.3. Regulatory Landscape
      • 4.4. Industry SWOT Analysis
      • 4.5. Porters Five Forces Analysis

      5. Global Automated Cell Cultures Market Analysis (USD Billion), Insights and Forecast, 2018-2029

      • 5.1. Key Findings / Summary
      • 5.2. Market Analysis, Insights and Forecast – By Segment 1
        • 5.2.1. Sub-Segment 1
        • 5.2.2. Sub-Segment 2
      • 5.3. Market Analysis, Insights and Forecast – By Segment 2
        • 5.3.1. Sub-Segment 1
        • 5.3.2. Sub-Segment 2
        • 5.3.3. Sub-Segment 3
        • 5.3.4. Others
      • 5.4. Market Analysis, Insights and Forecast – By Segment 3
        • 5.4.1. Sub-Segment 1
        • 5.4.2. Sub-Segment 2
        • 5.4.3. Sub-Segment 3
        • 5.4.4. Others
      • 5.5. Market Analysis, Insights and Forecast – By Region
        • 5.5.1. North America
        • 5.5.2. Latin America
        • 5.5.3. Europe
        • 5.5.4. Asia Pacific
        • 5.5.5. Middle East and Africa

      6. North America Automated Cell Cultures Market Analysis (USD Billion), Insights and Forecast, 2018-2029

      • 6.1. Key Findings / Summary
      • 6.2. Market Analysis, Insights and Forecast – By Segment 1
        • 6.2.1. Sub-Segment 1
        • 6.2.2. Sub-Segment 2
      • 6.3. Market Analysis, Insights and Forecast – By Segment 2
        • 6.3.1. Sub-Segment 1
        • 6.3.2. Sub-Segment 2
        • 6.3.3. Sub-Segment 3
        • 6.3.4. Others
      • 6.4. Market Analysis, Insights and Forecast – By Segment 3
        • 6.4.1. Sub-Segment 1
        • 6.4.2. Sub-Segment 2
        • 6.4.3. Sub-Segment 3
        • 6.4.4. Others
      • 6.5. Market Analysis, Insights and Forecast – By Country
        • 6.5.1. U.S.
        • 6.5.2. Canada

      7. Latin America Automated Cell Cultures Market Analysis (USD Billion), Insights and Forecast, 2018-2029

      • 7.1. Key Findings / Summary
      • 7.2. Market Analysis, Insights and Forecast – By Segment 1
        • 7.2.1. Sub-Segment 1
        • 7.2.2. Sub-Segment 2
      • 7.3. Market Analysis, Insights and Forecast – By Segment 2
        • 7.3.1. Sub-Segment 1
        • 7.3.2. Sub-Segment 2
        • 7.3.3. Sub-Segment 3
        • 7.3.4. Others
      • 7.4. Market Analysis, Insights and Forecast – By Segment 3
        • 7.4.1. Sub-Segment 1
        • 7.4.2. Sub-Segment 2
        • 7.4.3. Sub-Segment 3
        • 7.4.4. Others
      • 7.5. Insights and Forecast – By Country
        • 7.5.1. Brazil
        • 7.5.2. Mexico
        • 7.5.3. Rest of Latin America

      8. Europe Automated Cell Cultures Market Analysis (USD Billion), Insights and Forecast, 2018-2029

      • 8.1. Key Findings / Summary
      • 8.2. Market Analysis, Insights and Forecast – By Segment 1
        • 8.2.1. Sub-Segment 1
        • 8.2.2. Sub-Segment 2
      • 8.3. Market Analysis, Insights and Forecast – By Segment 2
        • 8.3.1. Sub-Segment 1
        • 8.3.2. Sub-Segment 2
        • 8.3.3. Sub-Segment 3
        • 8.3.4. Others
      • 8.4. Market Analysis, Insights and Forecast – By Segment 3
        • 8.4.1. Sub-Segment 1
        • 8.4.2. Sub-Segment 2
        • 8.4.3. Sub-Segment 3
        • 8.4.4. Others
      • 8.5. Market Analysis, Insights and Forecast – By Country
        • 8.5.1. UK
        • 8.5.2. Germany
        • 8.5.3. France
        • 8.5.4. Italy
        • 8.5.5. Spain
        • 8.5.6. Russia
        • 8.5.7. Rest of Europe

      9. Asia Pacific Automated Cell Cultures Market Analysis (USD Billion), Insights and Forecast, 2018-2029

      • 9.1. Key Findings / Summary
      • 9.2. Market Analysis, Insights and Forecast – By Segment 1
        • 9.2.1. Sub-Segment 1
        • 9.2.2. Sub-Segment 2
      • 9.3. Market Analysis, Insights and Forecast – By Segment 2
        • 9.3.1. Sub-Segment 1
        • 9.3.2. Sub-Segment 2
        • 9.3.3. Sub-Segment 3
        • 9.3.4. Others
      • 9.4. Market Analysis, Insights and Forecast – By Segment 3
        • 9.4.1. Sub-Segment 1
        • 9.4.2. Sub-Segment 2
        • 9.4.3. Sub-Segment 3
        • 9.4.4. Others
      • 9.5. Market Analysis, Insights and Forecast – By Country
        • 9.5.1. China
        • 9.5.2. India
        • 9.5.3. Japan
        • 9.5.4. Australia
        • 9.5.5. South East Asia
        • 9.5.6. Rest of Asia Pacific

      10. Middle East & Africa Automated Cell Cultures Market Analysis (USD Billion), Insights and Forecast, 2018-2029

      • 10.1. Key Findings / Summary
      • 10.2. Market Analysis, Insights and Forecast – By Segment 1
        • 10.2.1. Sub-Segment 1
        • 10.2.2. Sub-Segment 2
      • 10.3. Market Analysis, Insights and Forecast – By Segment 2
        • 10.3.1. Sub-Segment 1
        • 10.3.2. Sub-Segment 2
        • 10.3.3. Sub-Segment 3
        • 10.3.4. Others
      • 10.4. Market Analysis, Insights and Forecast – By Segment 3
        • 10.4.1. Sub-Segment 1
        • 10.4.2. Sub-Segment 2
        • 10.4.3. Sub-Segment 3
        • 10.4.4. Others
      • 10.5. Market Analysis, Insights and Forecast – By Country
        • 10.5.1. GCC
        • 10.5.2. South Africa
        • 10.5.3. Rest of Middle East & Africa

      11. Competitive Analysis

      • 11.1. Company Market Share Analysis, 2018
      • 11.2. Key Industry Developments
      • 11.3. Company Profile
        • 11.3.1. Company 1
          • 11.3.1.1. Business Overview
          • 11.3.1.2. Segment 1 & Service Offering
          • 11.3.1.3. Overall Revenue
          • 11.3.1.4. Geographic Presence
          • 11.3.1.5. Recent Development
        *Similar details will be provided for the following companies
        • 11.3.2. Company 2
        • 11.3.3. Company 3
        • 11.3.4. Company 4
        • 11.3.5. Company 5
        • 11.3.6. Company 6
        • 11.3.7. Company 7
        • 11.3.8. Company 8
        • 11.3.9. Company 9
        • 11.3.10. Company 10
        • 11.3.11. Company 11
        • 11.3.12. Company 12
      List of Figures

      Figure 1: Global Automated Cell Cultures Market Revenue Breakdown (USD Billion, %) by Region, 2022 & 2029
      Figure 2: Global Automated Cell Cultures Market Value Share (%), By Segment 1, 2022 & 2029
      Figure 3: Global Automated Cell Cultures Market Forecast (USD Billion), by Sub-Segment 1, 2018-2029
      Figure 4: Global Automated Cell Cultures Market Forecast (USD Billion), by Sub-Segment 2, 2018-2029
      Figure 5: Global Automated Cell Cultures Market Value Share (%), By Segment 2, 2022 & 2029
      Figure 6: Global Automated Cell Cultures Market Forecast (USD Billion), by Sub-Segment 1, 2018-2029
      Figure 7: Global Automated Cell Cultures Market Forecast (USD Billion), by Sub-Segment 2, 2018-2029
      Figure 8: Global Automated Cell Cultures Market Forecast (USD Billion), by Sub-Segment 3, 2018-2029
      Figure 9: Global Automated Cell Cultures Market Forecast (USD Billion), by Others, 2018-2029
      Figure 10: Global Automated Cell Cultures Market Value Share (%), By Segment 3, 2022 & 2029
      Figure 11: Global Automated Cell Cultures Market Forecast (USD Billion), by Sub-Segment 1, 2018-2029
      Figure 12: Global Automated Cell Cultures Market Forecast (USD Billion), by Sub-Segment 2, 2018-2029
      Figure 13: Global Automated Cell Cultures Market Forecast (USD Billion), by Sub-Segment 3, 2018-2029
      Figure 14: Global Automated Cell Cultures Market Forecast (USD Billion), by Others, 2018-2029
      Figure 15: Global Automated Cell Cultures Market Value (USD Billion), by Region, 2022 & 2029
      Figure 16: North America Automated Cell Cultures Market Value Share (%), By Segment 1, 2022 & 2029
      Figure 17: North America Automated Cell Cultures Market Forecast (USD Billion), by Sub-Segment 1, 2018-2029
      Figure 18: North America Automated Cell Cultures Market Forecast (USD Billion), by Sub-Segment 2, 2018-2029
      Figure 19: North America Automated Cell Cultures Market Value Share (%), By Segment 2, 2022 & 2029
      Figure 20: North America Automated Cell Cultures Market Forecast (USD Billion), by Sub-Segment 1, 2018-2029
      Figure 21: North America Automated Cell Cultures Market Forecast (USD Billion), by Sub-Segment 2, 2018-2029
      Figure 22: North America Automated Cell Cultures Market Forecast (USD Billion), by Sub-Segment 3, 2018-2029
      Figure 23: North America Automated Cell Cultures Market Forecast (USD Billion), by Others, 2018-2029
      Figure 24: North America Automated Cell Cultures Market Value Share (%), By Segment 3, 2022 & 2029
      Figure 25: North America Automated Cell Cultures Market Forecast (USD Billion), by Sub-Segment 1, 2018-2029
      Figure 26: North America Automated Cell Cultures Market Forecast (USD Billion), by Sub-Segment 2, 2018-2029
      Figure 27: North America Automated Cell Cultures Market Forecast (USD Billion), by Sub-Segment 3, 2018-2029
      Figure 28: North America Automated Cell Cultures Market Forecast (USD Billion), by Others, 2018-2029
      Figure 29: North America Automated Cell Cultures Market Forecast (USD Billion), by U.S., 2018-2029
      Figure 30: North America Automated Cell Cultures Market Forecast (USD Billion), by Canada, 2018-2029
      Figure 31: Latin America Automated Cell Cultures Market Value Share (%), By Segment 1, 2022 & 2029
      Figure 32: Latin America Automated Cell Cultures Market Forecast (USD Billion), by Sub-Segment 1, 2018-2029
      Figure 33: Latin America Automated Cell Cultures Market Forecast (USD Billion), by Sub-Segment 2, 2018-2029
      Figure 34: Latin America Automated Cell Cultures Market Value Share (%), By Segment 2, 2022 & 2029
      Figure 35: Latin America Automated Cell Cultures Market Forecast (USD Billion), by Sub-Segment 1, 2018-2029
      Figure 36: Latin America Automated Cell Cultures Market Forecast (USD Billion), by Sub-Segment 2, 2018-2029
      Figure 37: Latin America Automated Cell Cultures Market Forecast (USD Billion), by Sub-Segment 3, 2018-2029
      Figure 38: Latin America Automated Cell Cultures Market Forecast (USD Billion), by Others, 2018-2029
      Figure 39: Latin America Automated Cell Cultures Market Value Share (%), By Segment 3, 2022 & 2029
      Figure 40: Latin America Automated Cell Cultures Market Forecast (USD Billion), by Sub-Segment 1, 2018-2029
      Figure 41: Latin America Automated Cell Cultures Market Forecast (USD Billion), by Sub-Segment 2, 2018-2029
      Figure 42: Latin America Automated Cell Cultures Market Forecast (USD Billion), by Sub-Segment 3, 2018-2029
      Figure 43: Latin America Automated Cell Cultures Market Forecast (USD Billion), by Others, 2018-2029
      Figure 44: Latin America Automated Cell Cultures Market Forecast (USD Billion), by Brazil, 2018-2029
      Figure 45: Latin America Automated Cell Cultures Market Forecast (USD Billion), by Mexico, 2018-2029
      Figure 46: Latin America Automated Cell Cultures Market Forecast (USD Billion), by Rest of Latin America, 2018-2029
      Figure 47: Europe Automated Cell Cultures Market Value Share (%), By Segment 1, 2022 & 2029
      Figure 48: Europe Automated Cell Cultures Market Forecast (USD Billion), by Sub-Segment 1, 2018-2029
      Figure 49: Europe Automated Cell Cultures Market Forecast (USD Billion), by Sub-Segment 2, 2018-2029
      Figure 50: Europe Automated Cell Cultures Market Value Share (%), By Segment 2, 2022 & 2029
      Figure 51: Europe Automated Cell Cultures Market Forecast (USD Billion), by Sub-Segment 1, 2018-2029
      Figure 52: Europe Automated Cell Cultures Market Forecast (USD Billion), by Sub-Segment 2, 2018-2029
      Figure 53: Europe Automated Cell Cultures Market Forecast (USD Billion), by Sub-Segment 3, 2018-2029
      Figure 54: Europe Automated Cell Cultures Market Forecast (USD Billion), by Others, 2018-2029
      Figure 55: Europe Automated Cell Cultures Market Value Share (%), By Segment 3, 2022 & 2029
      Figure 56: Europe Automated Cell Cultures Market Forecast (USD Billion), by Sub-Segment 1, 2018-2029
      Figure 57: Europe Automated Cell Cultures Market Forecast (USD Billion), by Sub-Segment 2, 2018-2029
      Figure 58: Europe Automated Cell Cultures Market Forecast (USD Billion), by Sub-Segment 3, 2018-2029
      Figure 59: Europe Automated Cell Cultures Market Forecast (USD Billion), by Others, 2018-2029
      Figure 60: Europe Automated Cell Cultures Market Forecast (USD Billion), by U.K., 2018-2029
      Figure 61: Europe Automated Cell Cultures Market Forecast (USD Billion), by Germany, 2018-2029
      Figure 62: Europe Automated Cell Cultures Market Forecast (USD Billion), by France, 2018-2029
      Figure 63: Europe Automated Cell Cultures Market Forecast (USD Billion), by Italy, 2018-2029
      Figure 64: Europe Automated Cell Cultures Market Forecast (USD Billion), by Spain, 2018-2029
      Figure 65: Europe Automated Cell Cultures Market Forecast (USD Billion), by Russia, 2018-2029
      Figure 66: Europe Automated Cell Cultures Market Forecast (USD Billion), by Rest of Europe, 2018-2029
      Figure 67: Asia Pacific Automated Cell Cultures Market Value Share (%), By Segment 1, 2022 & 2029
      Figure 68: Asia Pacific Automated Cell Cultures Market Forecast (USD Billion), by Sub-Segment 1, 2018-2029
      Figure 69: Asia Pacific Automated Cell Cultures Market Forecast (USD Billion), by Sub-Segment 2, 2018-2029
      Figure 70: Asia Pacific Automated Cell Cultures Market Value Share (%), By Segment 2, 2022 & 2029
      Figure 71: Asia Pacific Automated Cell Cultures Market Forecast (USD Billion), by Sub-Segment 1, 2018-2029
      Figure 72: Asia Pacific Automated Cell Cultures Market Forecast (USD Billion), by Sub-Segment 2, 2018-2029
      Figure 73: Asia Pacific Automated Cell Cultures Market Forecast (USD Billion), by Sub-Segment 3, 2018-2029
      Figure 74: Asia Pacific Automated Cell Cultures Market Forecast (USD Billion), by Others, 2018-2029
      Figure 75: Asia Pacific Automated Cell Cultures Market Value Share (%), By Segment 3, 2022 & 2029
      Figure 76: Asia Pacific Automated Cell Cultures Market Forecast (USD Billion), by Sub-Segment 1, 2018-2029
      Figure 77: Asia Pacific Automated Cell Cultures Market Forecast (USD Billion), by Sub-Segment 2, 2018-2029
      Figure 78: Asia Pacific Automated Cell Cultures Market Forecast (USD Billion), by Sub-Segment 3, 2018-2029
      Figure 79: Asia Pacific Automated Cell Cultures Market Forecast (USD Billion), by Others, 2018-2029
      Figure 80: Asia Pacific Automated Cell Cultures Market Forecast (USD Billion), by China, 2018-2029
      Figure 81: Asia Pacific Automated Cell Cultures Market Forecast (USD Billion), by India, 2018-2029
      Figure 82: Asia Pacific Automated Cell Cultures Market Forecast (USD Billion), by Japan, 2018-2029
      Figure 83: Asia Pacific Automated Cell Cultures Market Forecast (USD Billion), by Australia, 2018-2029
      Figure 84: Asia Pacific Automated Cell Cultures Market Forecast (USD Billion), by Southeast Asia, 2018-2029
      Figure 85: Asia Pacific Automated Cell Cultures Market Forecast (USD Billion), by Rest of Asia Pacific, 2018-2029
      Figure 86: Middle East & Africa Automated Cell Cultures Market Value Share (%), By Segment 1, 2022 & 2029
      Figure 87: Middle East & Africa Automated Cell Cultures Market Forecast (USD Billion), by Sub-Segment 1, 2018-2029
      Figure 88: Middle East & Africa Automated Cell Cultures Market Forecast (USD Billion), by Sub-Segment 2, 2018-2029
      Figure 89: Middle East & Africa Automated Cell Cultures Market Value Share (%), By Segment 2, 2022 & 2029
      Figure 90: Middle East & Africa Automated Cell Cultures Market Forecast (USD Billion), by Sub-Segment 1, 2018-2029
      Figure 91: Middle East & Africa Automated Cell Cultures Market Forecast (USD Billion), by Sub-Segment 2, 2018-2029
      Figure 92: Middle East & Africa Automated Cell Cultures Market Forecast (USD Billion), by Sub-Segment 3, 2018-2029
      Figure 93: Middle East & Africa Automated Cell Cultures Market Forecast (USD Billion), by Others, 2018-2029
      Figure 94: Middle East & Africa Automated Cell Cultures Market Value Share (%), By Segment 3, 2022 & 2029
      Figure 95: Middle East & Africa Automated Cell Cultures Market Forecast (USD Billion), by Sub-Segment 1, 2018-2029
      Figure 96: Middle East & Africa Automated Cell Cultures Market Forecast (USD Billion), by Sub-Segment 2, 2018-2029
      Figure 97: Middle East & Africa Automated Cell Cultures Market Forecast (USD Billion), by Sub-Segment 3, 2018-2029
      Figure 98: Middle East & Africa Automated Cell Cultures Market Forecast (USD Billion), by Others, 2018-2029
      Figure 99: Middle East & Africa Automated Cell Cultures Market Forecast (USD Billion), by GCC, 2018-2029
      Figure 100: Middle East & Africa Automated Cell Cultures Market Forecast (USD Billion), by South Africa, 2018-2029
      Figure 101: Middle East & Africa Automated Cell Cultures Market Forecast (USD Billion), by Rest of Middle East & Africa, 2018-2029 
      List of Tables
      Table 1: Global Automated Cell Cultures Market Revenue (USD Billion) Forecast, by Segment 1, 2018-2029
      Table 2: Global Automated Cell Cultures Market Revenue (USD Billion) Forecast, by Segment 2, 2018-2029
      Table 3: Global Automated Cell Cultures Market Revenue (USD Billion) Forecast, by Segment 3, 2018-2029
      Table 4: Global Automated Cell Cultures Market Revenue (USD Billion) Forecast, by Region, 2018-2029
      Table 5: North America Automated Cell Cultures Market Revenue (USD Billion) Forecast, by Segment 1, 2018-2029
      Table 6: North America Automated Cell Cultures Market Revenue (USD Billion) Forecast, by Segment 2, 2018-2029
      Table 7: North America Automated Cell Cultures Market Revenue (USD Billion) Forecast, by Segment 3, 2018-2029
      Table 8: North America Automated Cell Cultures Market Revenue (USD Billion) Forecast, by Country, 2018-2029
      Table 9: Europe Automated Cell Cultures Market Revenue (USD Billion) Forecast, by Segment 1, 2018-2029
      Table 10: Europe Automated Cell Cultures Market Revenue (USD Billion) Forecast, by Segment 2, 2018-2029
      Table 11: Europe Automated Cell Cultures Market Revenue (USD Billion) Forecast, by Segment 3, 2018-2029
      Table 12: Europe Automated Cell Cultures Market Revenue (USD Billion) Forecast, by Country, 2018-2029
      Table 13: Latin America Automated Cell Cultures Market Revenue (USD Billion) Forecast, by Segment 1, 2018-2029
      Table 14: Latin America Automated Cell Cultures Market Revenue (USD Billion) Forecast, by Segment 2, 2018-2029
      Table 15: Latin America Automated Cell Cultures Market Revenue (USD Billion) Forecast, by Segment 3, 2018-2029
      Table 16: Latin America Automated Cell Cultures Market Revenue (USD Billion) Forecast, by Country, 2018-2029
      Table 17: Asia Pacific Automated Cell Cultures Market Revenue (USD Billion) Forecast, by Segment 1, 2018-2029
      Table 18: Asia Pacific Automated Cell Cultures Market Revenue (USD Billion) Forecast, by Segment 2, 2018-2029
      Table 19: Asia Pacific Automated Cell Cultures Market Revenue (USD Billion) Forecast, by Segment 3, 2018-2029
      Table 20: Asia Pacific Automated Cell Cultures Market Revenue (USD Billion) Forecast, by Country, 2018-2029
      Table 21: Middle East & Africa Automated Cell Cultures Market Revenue (USD Billion) Forecast, by Segment 1, 2018-2029
      Table 22: Middle East & Africa Automated Cell Cultures Market Revenue (USD Billion) Forecast, by Segment 2, 2018-2029
      Table 23: Middle East & Africa Automated Cell Cultures Market Revenue (USD Billion) Forecast, by Segment 3, 2018-2029
      Table 24: Middle East & Africa Automated Cell Cultures Market Revenue (USD Billion) Forecast, by Country, 2018-2029
      Research Process

      Data Library Research are conducted by industry experts who offer insight on industry structure, market segmentations technology assessment and competitive landscape (CL), and penetration, as well as on emerging trends. Their analysis is based on primary interviews (~ 80%) and secondary research (~ 20%) as well as years of professional expertise in their respective industries. Adding to this, by analysing historical trends and current market positions, our analysts predict where the market will be headed for the next five years. Furthermore, the varying trends of segment & categories geographically presented are also studied and the estimated based on the primary & secondary research.

      In this particular report from the supply side Data Library Research has conducted primary surveys (interviews) with the key level executives (VP, CEO’s, Marketing Director, Business Development Manager and SOFT) of the companies that active & prominent as well as the midsized organization

      FIGURE 1: DLR RESEARH PROCESS

      research-methodology1

      Primary Research

      Extensive primary research was conducted to gain a deeper insight of the market and industry performance. The analysis is based on both primary and secondary research as well as years of professional expertise in the respective industries.

      In addition to analysing current and historical trends, our analysts predict where the market is headed over the next five years.

      It varies by segment for these categories geographically presented in the list of market tables. Speaking about this particular report we have conducted primary surveys (interviews) with the key level executives (VP, CEO’s, Marketing Director, Business Development Manager and many more) of the major players active in the market.

      Secondary Research

      Secondary research was mainly used to collect and identify information useful for the extensive, technical, market-oriented, and Friend’s study of the Global Extra Neutral Alcohol. It was also used to obtain key information about major players, market classification and segmentation according to the industry trends, geographical markets, and developments related to the market and technology perspectives. For this study, analysts have gathered information from various credible sources, such as annual reports, sec filings, journals, white papers, SOFT presentations, and company web sites.

      Market Size Estimation

      Both, top-down and bottom-up approaches were used to estimate and validate the size of the Global market and to estimate the size of various other dependent submarkets in the overall Extra Neutral Alcohol. The key players in the market were identified through secondary research and their market contributions in the respective geographies were determined through primary and secondary research.

      Forecast Model

      research-methodology2