Medium and High Voltage Power Devices Market Overview and Analysis:

The overall High & Medium Voltage Products Market was valued at approximately USD 40.76 billion in 2025 to USD 487.8 billion by 2032, growing with a CAGR of 21.25% from 2025-2032.

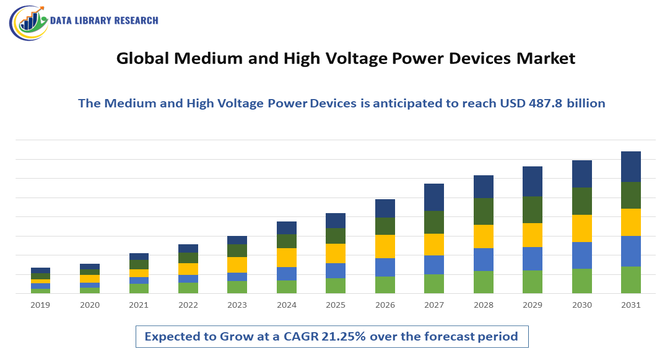
The Global Medium and High Voltage Power Devices Market is experiencing steady growth as industries and utilities continue to modernize power infrastructure and adopt advanced power electronics to meet increasing energy reliability, efficiency, and grid stability requirements. These devices—including IGBTs, MOSFETs, thyristors, insulated gate gate-commutated thyristors (IGCTs), and high-power diodes—are essential for power transmission, smart grids, renewable energy systems, industrial automation, and electric mobility applications. The transition toward renewable energy sources such as solar and wind, along with the rising deployment of HVDC transmission systems, grid automation, and energy storage solutions, is increasing the adoption of medium and high-power switching and control devices.

Medium and High Voltage Power Devices Market Latest Trends:

The Global Medium and High Voltage Power Devices Market is witnessing several emerging trends, with one of the most notable being the rapid adoption of wide-bandgap semiconductor materials such as silicon carbide (SiC) and gallium nitride (GaN), which offer higher efficiency, improved thermal performance, and faster switching capabilities compared to traditional silicon-based devices. There is also a growing shift toward integrated and modular power modules designed to reduce system size, improve power density, and simplify deployment in high-voltage applications.

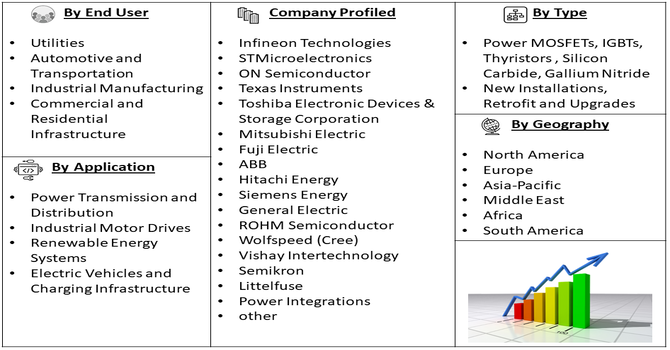
Segmentation: Global Medium and High Voltage Power Devices Market is segmented By Device Type (Power MOSFETs, IGBTs, Thyristors, Silicon Carbide, Gallium Nitride), Installation Type (New Installations, Retrofit and Upgrades), Application (Power Transmission and Distribution, Industrial Motor Drives, Renewable Energy Systems, Electric Vehicles and Charging Infrastructure), End User (Utilities, Automotive and Transportation, Industrial Manufacturing, Commercial and Residential Infrastructure), and Geography (North America, Europe, Asia-Pacific, Middle East and Africa, and South America). The report provides the value (in USD million) for the above segments.

Market Drivers:

  • Rising Demand for Renewable Energy and Grid Modernization

The rapid integration of renewable energy sources such as solar and wind, along with increasing investments in smart grid infrastructure, energy storage systems, and high-efficiency transmission networks, is driving strong demand for medium and high voltage power devices to improve power stability, reduce transmission losses, and enable efficient power conversion.

In August 2024, Hitachi Energy called for urgent action to expand global power grids, reduce connection bottlenecks, and accelerate the energy transition through advanced power electronics technology. With 3,000 GW of renewable projects waiting in grid queues and 80 million km of grids requiring upgrades by 2040, the demand for modernized, controlled interconnections grew. This scenario boosted the global medium and high voltage power devices market, driven by rising renewable energy adoption, grid modernization efforts, and the need for stable, efficient, and resilient power systems.

  • Electrification of Transportation and Industrial Automation

The expansion of electric vehicles (EVs), EV fast-charging networks, and electrified public transport systems, coupled with the growing adoption of automation in industrial processes, is accelerating the need for high-performance power devices like IGBTs, SiC, and GaN modules, which deliver high efficiency, reliability, and thermal stability in high-voltage applications.

In April 2020, ABB announced its role as a supplier of high-voltage-capable chargers for the Volvo LIGHTS project, providing charging systems capable of up to 920 VDC to enable faster charging and improved fleet utilization. The project, a collaboration between Volvo Group, Volvo Trucks, Greenlots, and other stakeholders, demonstrated how battery electric vehicles could optimize freight and warehouse operations, reduce emissions, and enhance air quality. This initiative strengthened the global medium and high voltage power devices market by supporting transportation electrification and industrial automation.

Market Restraints

  • Stringent Regulatory Standards

The sector is challenged by long product qualification cycles, stringent regulatory standards, and complex certification requirements, particularly for applications in power transmission, aerospace, and automotive safety systems. Supply chain instability—especially in semiconductor fabrication, raw material availability, and rare-earth component sourcing—continues to pose risks, leading to extended lead times and pricing volatility. Furthermore, the lack of skilled technical expertise required for integration, maintenance, and system-level calibration creates barriers, particularly in developing economies where infrastructure modernization is still emerging, collectively slowing the full-scale deployment of medium and high voltage power devices.

Socio Economic Impact on Medium and High Voltage Power Devices Market

The global medium and high voltage power devices market has a significant socioeconomic impact by enabling the efficient generation, transmission, and distribution of electricity across industries and communities. These devices support reliable power supply, reduce energy losses, and improve grid stability, which in turn drives industrial productivity, economic growth, and urban development. By creating demand for skilled engineers, technicians, and manufacturing jobs, the market also contributes to employment and technological advancement worldwide.

Segmental Analysis:

  • IGBTs segment is expected to witness highest growth over the forecast period

Within the device type category, Insulated Gate Bipolar Transistors (IGBTs) hold a prominent share due to their widespread adoption in high-voltage switching applications such as transmission systems, renewable energy inverters, and electric vehicle power modules. Their efficiency, higher power handling capability, and suitability for medium-to-high voltage environments make them a preferred choice over traditional silicon-based devices, especially as demand grows for fast-switching and energy-efficient power conversion technologies.

  • Retrofit and Upgrades segment is expected to witness highest growth over the forecast period

In the installation type segment, retrofit and upgrade solutions are witnessing growing demand as aging grid infrastructure worldwide requires modernization to support higher load capacity, digital monitoring, and renewable power integration. Utilities and industrial users increasingly prefer retrofitting over full replacement to minimize cost, downtime, and installation complexity, making this segment a key contributor to market expansion.

  • Electric Vehicles and Charging Infrastructure segment is expected to witness highest growth over the forecast period

Among applications, the electric vehicles and charging infrastructure segment is experiencing rapid growth driven by global electrification initiatives, stringent emission reduction mandates, and increasing EV adoption. Medium and high-voltage devices are crucial in onboard chargers, powertrain modules, DC fast-charging systems, and battery management, positioning this segment as a major demand accelerator in the forecast period.

  • Utilities segment is expected to witness highest growth over the forecast period

The utilities segment dominates end-user demand as power companies invest heavily in high-voltage devices for grid strengthening, smart meter integration, transformer upgrades, substation automation, and distributed energy management. The transition toward smart grids and renewable-based power generation further amplifies the need for efficient switching, protection, and transmission components, ensuring strong utility-driven growth.

  • North America region is expected to witness highest growth over the forecast period

The North America region is expected to witness the highest growth over the forecast period, supported by significant investments in upgrading aging power infrastructure and integrating renewable energy sources into the grid. The region is also experiencing rapid growth in electric vehicle penetration, prompting expansion of charging networks and high-voltage power electronics in transportation.

In November 2025, Amperesand, a global provider in next-generation power infrastructure for AI data centers and critical power applications, closed an USD 80 million Series A funding round co-led by Walden Catalyst Ventures and Temasek. The oversubscribed round included new investors Industry Ventures, Acclimate Ventures, and SG Growth Capital, alongside continued support from Xora Innovation, Material Impact, TDK Ventures, and Foothill Ventures. This funding strengthened the U.S. medium and high voltage power devices market by accelerating the development of advanced, high-efficiency power solutions for AI and critical infrastructure.

Additionally, strong governmental policies promoting energy efficiency, advanced semiconductor innovation, and manufacturing expansion—particularly in the United States—are further accelerating the adoption of medium and high voltage power devices. Thus, together, these factors position North America as a leading contributor to market growth in the coming years.

Medium and High Voltage Power Devices Market Competitive Landscape:

The competitive landscape of the Global Medium and High Voltage Power Devices Market is shaped by a mix of large semiconductor manufacturers, specialized power-module producers, and industrial conglomerates competing on device performance (efficiency, voltage rating, thermal management), wide-bandgap technology leadership (SiC/GaN), system-level integration, reliability, and global service/support capabilities.

Key Players:

  • Infineon Technologies
  • STMicroelectronics
  • ON Semiconductor
  • Texas Instruments
  • Toshiba Electronic Devices & Storage Corporation
  • Mitsubishi Electric
  • Fuji Electric
  • ABB
  • Hitachi Energy
  • Siemens Energy
  • General Electric
  • ROHM Semiconductor
  • Wolfspeed (Cree)
  • Vishay Intertechnology
  • Semikron
  • Littelfuse
  • Power Integrations
  • Nexperia
  • Schneider Electric
  • Microchip Technology

Recent Development:

  • In October 2025, Navitas Semiconductor, announced progress in developing advanced 800 VDC medium- and high-voltage GaN and SiC devices to support NVIDIA’s 800 VDC architecture for next-generation AI factory computing platforms. The rise of AI factories created power challenges that legacy 54 V data centers could not meet. This development strengthened the global medium and high voltage power devices market by driving demand for higher-efficiency, high-density power solutions.


  • In September 2025, NoMIS Power Corporation, announced the commercial release of its first 3.3 kV SiC MOSFET, the NoMIS N3PT080MP330. This planar device, with an on-resistance of just 80 mΩ (34 A) and best-in-class figures of merit, extended NoMIS Power’s technology into the medium-voltage domain. It enabled higher efficiency, reliability, and performance for applications such as battery energy storage systems, renewable energy converters, transportation electrification, and industrial motor drives, while providing advantages over legacy silicon solutions.


Frequently Asked Questions (FAQ) :

Q1. What are the main growth-driving factors for this market?

The market is strongly driven by massive global investment in power infrastructure and the urgent need to integrate more renewable energy sources like wind and solar power into the electric grid. Medium and High Voltage (MHV) devices are essential for efficiently transmitting this electricity over long distances and stabilizing the grid. Furthermore, the push for grid modernization and smart grid technology, which requires advanced components for better power management, significantly accelerates market expansion.

Q2. What are the main restraining factors for this market?

A primary challenge is the high capital expenditure required for purchasing and installing these sophisticated MHV power devices, which can be a barrier for smaller utility companies. The market is also hindered by the complexity and long lead times involved in the rigorous testing and certification processes required for new, high-voltage equipment. Additionally, the fluctuating costs of raw materials, such as copper and specialized alloys, can introduce price volatility and restrain steady market growth.

Q3. Which segment is expected to witness high growth?

The High Voltage Direct Current (HVDC) Transmission segment is expected to see the highest growth. This is because HVDC systems are much more efficient than traditional AC systems for transferring bulk power over great distances, especially from remote renewable energy farms, such as offshore wind. The growing demand for robust grid interconnections between different regions and the increased focus on large-scale solar and wind projects are fueling this significant adoption rate.

Q4. Who are the top major players for this market?

The MHV power devices market is highly competitive and dominated by a few global engineering giants. The top players include ABB, which offers a comprehensive range of power and automation technologies, Siemens Energy, known for its extensive portfolio of high-voltage transmission products, and Mitsubishi Electric. Other key industry contributors are General Electric (GE) and Eaton Corporation, all focusing on developing innovative, smart grid-compatible devices and expanding their global distribution networks.

Q5. Which country is the largest player?

US, in North America is expected to witness the highest growth in the global medium and high voltage power devices market over the forecast period, driven by increasing investments in renewable energy, grid modernization, electrification of transportation, and advanced industrial automation. Strong demand for reliable, efficient, and high-capacity power solutions is fueling market expansion.

Medium and High Voltage Power Devices MARKET STUDY GLOBAL MARKET ANALYSIS, INSIGHTS AND FORECAST, 2022-2029

    1. Introduction

    • 1.1. Research Scope
    • 1.2. Market Segmentation
    • 1.3. Research Methodology
    • 1.4. Definitions and Assumptions

    2. Executive Summary

      3. Market Dynamics

      • 3.1. Market Drivers
      • 3.2. Market Restraints
      • 3.3. Market Opportunities

      4. Key Insights

      • 4.1. Key Emerging Trends – For Major Countries
      • 4.2. Latest Technological Advancement
      • 4.3. Regulatory Landscape
      • 4.4. Industry SWOT Analysis
      • 4.5. Porters Five Forces Analysis

      5. Global Medium and High Voltage Power Devices Market Analysis (USD Billion), Insights and Forecast, 2018-2029

      • 5.1. Key Findings / Summary
      • 5.2. Market Analysis, Insights and Forecast – By Segment 1
        • 5.2.1. Sub-Segment 1
        • 5.2.2. Sub-Segment 2
      • 5.3. Market Analysis, Insights and Forecast – By Segment 2
        • 5.3.1. Sub-Segment 1
        • 5.3.2. Sub-Segment 2
        • 5.3.3. Sub-Segment 3
        • 5.3.4. Others
      • 5.4. Market Analysis, Insights and Forecast – By Segment 3
        • 5.4.1. Sub-Segment 1
        • 5.4.2. Sub-Segment 2
        • 5.4.3. Sub-Segment 3
        • 5.4.4. Others
      • 5.5. Market Analysis, Insights and Forecast – By Region
        • 5.5.1. North America
        • 5.5.2. Latin America
        • 5.5.3. Europe
        • 5.5.4. Asia Pacific
        • 5.5.5. Middle East and Africa

      6. North America Medium and High Voltage Power Devices Market Analysis (USD Billion), Insights and Forecast, 2018-2029

      • 6.1. Key Findings / Summary
      • 6.2. Market Analysis, Insights and Forecast – By Segment 1
        • 6.2.1. Sub-Segment 1
        • 6.2.2. Sub-Segment 2
      • 6.3. Market Analysis, Insights and Forecast – By Segment 2
        • 6.3.1. Sub-Segment 1
        • 6.3.2. Sub-Segment 2
        • 6.3.3. Sub-Segment 3
        • 6.3.4. Others
      • 6.4. Market Analysis, Insights and Forecast – By Segment 3
        • 6.4.1. Sub-Segment 1
        • 6.4.2. Sub-Segment 2
        • 6.4.3. Sub-Segment 3
        • 6.4.4. Others
      • 6.5. Market Analysis, Insights and Forecast – By Country
        • 6.5.1. U.S.
        • 6.5.2. Canada

      7. Latin America Medium and High Voltage Power Devices Market Analysis (USD Billion), Insights and Forecast, 2018-2029

      • 7.1. Key Findings / Summary
      • 7.2. Market Analysis, Insights and Forecast – By Segment 1
        • 7.2.1. Sub-Segment 1
        • 7.2.2. Sub-Segment 2
      • 7.3. Market Analysis, Insights and Forecast – By Segment 2
        • 7.3.1. Sub-Segment 1
        • 7.3.2. Sub-Segment 2
        • 7.3.3. Sub-Segment 3
        • 7.3.4. Others
      • 7.4. Market Analysis, Insights and Forecast – By Segment 3
        • 7.4.1. Sub-Segment 1
        • 7.4.2. Sub-Segment 2
        • 7.4.3. Sub-Segment 3
        • 7.4.4. Others
      • 7.5. Insights and Forecast – By Country
        • 7.5.1. Brazil
        • 7.5.2. Mexico
        • 7.5.3. Rest of Latin America

      8. Europe Medium and High Voltage Power Devices Market Analysis (USD Billion), Insights and Forecast, 2018-2029

      • 8.1. Key Findings / Summary
      • 8.2. Market Analysis, Insights and Forecast – By Segment 1
        • 8.2.1. Sub-Segment 1
        • 8.2.2. Sub-Segment 2
      • 8.3. Market Analysis, Insights and Forecast – By Segment 2
        • 8.3.1. Sub-Segment 1
        • 8.3.2. Sub-Segment 2
        • 8.3.3. Sub-Segment 3
        • 8.3.4. Others
      • 8.4. Market Analysis, Insights and Forecast – By Segment 3
        • 8.4.1. Sub-Segment 1
        • 8.4.2. Sub-Segment 2
        • 8.4.3. Sub-Segment 3
        • 8.4.4. Others
      • 8.5. Market Analysis, Insights and Forecast – By Country
        • 8.5.1. UK
        • 8.5.2. Germany
        • 8.5.3. France
        • 8.5.4. Italy
        • 8.5.5. Spain
        • 8.5.6. Russia
        • 8.5.7. Rest of Europe

      9. Asia Pacific Medium and High Voltage Power Devices Market Analysis (USD Billion), Insights and Forecast, 2018-2029

      • 9.1. Key Findings / Summary
      • 9.2. Market Analysis, Insights and Forecast – By Segment 1
        • 9.2.1. Sub-Segment 1
        • 9.2.2. Sub-Segment 2
      • 9.3. Market Analysis, Insights and Forecast – By Segment 2
        • 9.3.1. Sub-Segment 1
        • 9.3.2. Sub-Segment 2
        • 9.3.3. Sub-Segment 3
        • 9.3.4. Others
      • 9.4. Market Analysis, Insights and Forecast – By Segment 3
        • 9.4.1. Sub-Segment 1
        • 9.4.2. Sub-Segment 2
        • 9.4.3. Sub-Segment 3
        • 9.4.4. Others
      • 9.5. Market Analysis, Insights and Forecast – By Country
        • 9.5.1. China
        • 9.5.2. India
        • 9.5.3. Japan
        • 9.5.4. Australia
        • 9.5.5. South East Asia
        • 9.5.6. Rest of Asia Pacific

      10. Middle East & Africa Medium and High Voltage Power Devices Market Analysis (USD Billion), Insights and Forecast, 2018-2029

      • 10.1. Key Findings / Summary
      • 10.2. Market Analysis, Insights and Forecast – By Segment 1
        • 10.2.1. Sub-Segment 1
        • 10.2.2. Sub-Segment 2
      • 10.3. Market Analysis, Insights and Forecast – By Segment 2
        • 10.3.1. Sub-Segment 1
        • 10.3.2. Sub-Segment 2
        • 10.3.3. Sub-Segment 3
        • 10.3.4. Others
      • 10.4. Market Analysis, Insights and Forecast – By Segment 3
        • 10.4.1. Sub-Segment 1
        • 10.4.2. Sub-Segment 2
        • 10.4.3. Sub-Segment 3
        • 10.4.4. Others
      • 10.5. Market Analysis, Insights and Forecast – By Country
        • 10.5.1. GCC
        • 10.5.2. South Africa
        • 10.5.3. Rest of Middle East & Africa

      11. Competitive Analysis

      • 11.1. Company Market Share Analysis, 2018
      • 11.2. Key Industry Developments
      • 11.3. Company Profile
        • 11.3.1. Company 1
          • 11.3.1.1. Business Overview
          • 11.3.1.2. Segment 1 & Service Offering
          • 11.3.1.3. Overall Revenue
          • 11.3.1.4. Geographic Presence
          • 11.3.1.5. Recent Development
        *Similar details will be provided for the following companies
        • 11.3.2. Company 2
        • 11.3.3. Company 3
        • 11.3.4. Company 4
        • 11.3.5. Company 5
        • 11.3.6. Company 6
        • 11.3.7. Company 7
        • 11.3.8. Company 8
        • 11.3.9. Company 9
        • 11.3.10. Company 10
        • 11.3.11. Company 11
        • 11.3.12. Company 12
      List of Figures

      Figure 1: Global Medium and High Voltage Power Devices Market Revenue Breakdown (USD Billion, %) by Region, 2022 & 2029
      Figure 2: Global Medium and High Voltage Power Devices Market Value Share (%), By Segment 1, 2022 & 2029
      Figure 3: Global Medium and High Voltage Power Devices Market Forecast (USD Billion), by Sub-Segment 1, 2018-2029
      Figure 4: Global Medium and High Voltage Power Devices Market Forecast (USD Billion), by Sub-Segment 2, 2018-2029
      Figure 5: Global Medium and High Voltage Power Devices Market Value Share (%), By Segment 2, 2022 & 2029
      Figure 6: Global Medium and High Voltage Power Devices Market Forecast (USD Billion), by Sub-Segment 1, 2018-2029
      Figure 7: Global Medium and High Voltage Power Devices Market Forecast (USD Billion), by Sub-Segment 2, 2018-2029
      Figure 8: Global Medium and High Voltage Power Devices Market Forecast (USD Billion), by Sub-Segment 3, 2018-2029
      Figure 9: Global Medium and High Voltage Power Devices Market Forecast (USD Billion), by Others, 2018-2029
      Figure 10: Global Medium and High Voltage Power Devices Market Value Share (%), By Segment 3, 2022 & 2029
      Figure 11: Global Medium and High Voltage Power Devices Market Forecast (USD Billion), by Sub-Segment 1, 2018-2029
      Figure 12: Global Medium and High Voltage Power Devices Market Forecast (USD Billion), by Sub-Segment 2, 2018-2029
      Figure 13: Global Medium and High Voltage Power Devices Market Forecast (USD Billion), by Sub-Segment 3, 2018-2029
      Figure 14: Global Medium and High Voltage Power Devices Market Forecast (USD Billion), by Others, 2018-2029
      Figure 15: Global Medium and High Voltage Power Devices Market Value (USD Billion), by Region, 2022 & 2029
      Figure 16: North America Medium and High Voltage Power Devices Market Value Share (%), By Segment 1, 2022 & 2029
      Figure 17: North America Medium and High Voltage Power Devices Market Forecast (USD Billion), by Sub-Segment 1, 2018-2029
      Figure 18: North America Medium and High Voltage Power Devices Market Forecast (USD Billion), by Sub-Segment 2, 2018-2029
      Figure 19: North America Medium and High Voltage Power Devices Market Value Share (%), By Segment 2, 2022 & 2029
      Figure 20: North America Medium and High Voltage Power Devices Market Forecast (USD Billion), by Sub-Segment 1, 2018-2029
      Figure 21: North America Medium and High Voltage Power Devices Market Forecast (USD Billion), by Sub-Segment 2, 2018-2029
      Figure 22: North America Medium and High Voltage Power Devices Market Forecast (USD Billion), by Sub-Segment 3, 2018-2029
      Figure 23: North America Medium and High Voltage Power Devices Market Forecast (USD Billion), by Others, 2018-2029
      Figure 24: North America Medium and High Voltage Power Devices Market Value Share (%), By Segment 3, 2022 & 2029
      Figure 25: North America Medium and High Voltage Power Devices Market Forecast (USD Billion), by Sub-Segment 1, 2018-2029
      Figure 26: North America Medium and High Voltage Power Devices Market Forecast (USD Billion), by Sub-Segment 2, 2018-2029
      Figure 27: North America Medium and High Voltage Power Devices Market Forecast (USD Billion), by Sub-Segment 3, 2018-2029
      Figure 28: North America Medium and High Voltage Power Devices Market Forecast (USD Billion), by Others, 2018-2029
      Figure 29: North America Medium and High Voltage Power Devices Market Forecast (USD Billion), by U.S., 2018-2029
      Figure 30: North America Medium and High Voltage Power Devices Market Forecast (USD Billion), by Canada, 2018-2029
      Figure 31: Latin America Medium and High Voltage Power Devices Market Value Share (%), By Segment 1, 2022 & 2029
      Figure 32: Latin America Medium and High Voltage Power Devices Market Forecast (USD Billion), by Sub-Segment 1, 2018-2029
      Figure 33: Latin America Medium and High Voltage Power Devices Market Forecast (USD Billion), by Sub-Segment 2, 2018-2029
      Figure 34: Latin America Medium and High Voltage Power Devices Market Value Share (%), By Segment 2, 2022 & 2029
      Figure 35: Latin America Medium and High Voltage Power Devices Market Forecast (USD Billion), by Sub-Segment 1, 2018-2029
      Figure 36: Latin America Medium and High Voltage Power Devices Market Forecast (USD Billion), by Sub-Segment 2, 2018-2029
      Figure 37: Latin America Medium and High Voltage Power Devices Market Forecast (USD Billion), by Sub-Segment 3, 2018-2029
      Figure 38: Latin America Medium and High Voltage Power Devices Market Forecast (USD Billion), by Others, 2018-2029
      Figure 39: Latin America Medium and High Voltage Power Devices Market Value Share (%), By Segment 3, 2022 & 2029
      Figure 40: Latin America Medium and High Voltage Power Devices Market Forecast (USD Billion), by Sub-Segment 1, 2018-2029
      Figure 41: Latin America Medium and High Voltage Power Devices Market Forecast (USD Billion), by Sub-Segment 2, 2018-2029
      Figure 42: Latin America Medium and High Voltage Power Devices Market Forecast (USD Billion), by Sub-Segment 3, 2018-2029
      Figure 43: Latin America Medium and High Voltage Power Devices Market Forecast (USD Billion), by Others, 2018-2029
      Figure 44: Latin America Medium and High Voltage Power Devices Market Forecast (USD Billion), by Brazil, 2018-2029
      Figure 45: Latin America Medium and High Voltage Power Devices Market Forecast (USD Billion), by Mexico, 2018-2029
      Figure 46: Latin America Medium and High Voltage Power Devices Market Forecast (USD Billion), by Rest of Latin America, 2018-2029
      Figure 47: Europe Medium and High Voltage Power Devices Market Value Share (%), By Segment 1, 2022 & 2029
      Figure 48: Europe Medium and High Voltage Power Devices Market Forecast (USD Billion), by Sub-Segment 1, 2018-2029
      Figure 49: Europe Medium and High Voltage Power Devices Market Forecast (USD Billion), by Sub-Segment 2, 2018-2029
      Figure 50: Europe Medium and High Voltage Power Devices Market Value Share (%), By Segment 2, 2022 & 2029
      Figure 51: Europe Medium and High Voltage Power Devices Market Forecast (USD Billion), by Sub-Segment 1, 2018-2029
      Figure 52: Europe Medium and High Voltage Power Devices Market Forecast (USD Billion), by Sub-Segment 2, 2018-2029
      Figure 53: Europe Medium and High Voltage Power Devices Market Forecast (USD Billion), by Sub-Segment 3, 2018-2029
      Figure 54: Europe Medium and High Voltage Power Devices Market Forecast (USD Billion), by Others, 2018-2029
      Figure 55: Europe Medium and High Voltage Power Devices Market Value Share (%), By Segment 3, 2022 & 2029
      Figure 56: Europe Medium and High Voltage Power Devices Market Forecast (USD Billion), by Sub-Segment 1, 2018-2029
      Figure 57: Europe Medium and High Voltage Power Devices Market Forecast (USD Billion), by Sub-Segment 2, 2018-2029
      Figure 58: Europe Medium and High Voltage Power Devices Market Forecast (USD Billion), by Sub-Segment 3, 2018-2029
      Figure 59: Europe Medium and High Voltage Power Devices Market Forecast (USD Billion), by Others, 2018-2029
      Figure 60: Europe Medium and High Voltage Power Devices Market Forecast (USD Billion), by U.K., 2018-2029
      Figure 61: Europe Medium and High Voltage Power Devices Market Forecast (USD Billion), by Germany, 2018-2029
      Figure 62: Europe Medium and High Voltage Power Devices Market Forecast (USD Billion), by France, 2018-2029
      Figure 63: Europe Medium and High Voltage Power Devices Market Forecast (USD Billion), by Italy, 2018-2029
      Figure 64: Europe Medium and High Voltage Power Devices Market Forecast (USD Billion), by Spain, 2018-2029
      Figure 65: Europe Medium and High Voltage Power Devices Market Forecast (USD Billion), by Russia, 2018-2029
      Figure 66: Europe Medium and High Voltage Power Devices Market Forecast (USD Billion), by Rest of Europe, 2018-2029
      Figure 67: Asia Pacific Medium and High Voltage Power Devices Market Value Share (%), By Segment 1, 2022 & 2029
      Figure 68: Asia Pacific Medium and High Voltage Power Devices Market Forecast (USD Billion), by Sub-Segment 1, 2018-2029
      Figure 69: Asia Pacific Medium and High Voltage Power Devices Market Forecast (USD Billion), by Sub-Segment 2, 2018-2029
      Figure 70: Asia Pacific Medium and High Voltage Power Devices Market Value Share (%), By Segment 2, 2022 & 2029
      Figure 71: Asia Pacific Medium and High Voltage Power Devices Market Forecast (USD Billion), by Sub-Segment 1, 2018-2029
      Figure 72: Asia Pacific Medium and High Voltage Power Devices Market Forecast (USD Billion), by Sub-Segment 2, 2018-2029
      Figure 73: Asia Pacific Medium and High Voltage Power Devices Market Forecast (USD Billion), by Sub-Segment 3, 2018-2029
      Figure 74: Asia Pacific Medium and High Voltage Power Devices Market Forecast (USD Billion), by Others, 2018-2029
      Figure 75: Asia Pacific Medium and High Voltage Power Devices Market Value Share (%), By Segment 3, 2022 & 2029
      Figure 76: Asia Pacific Medium and High Voltage Power Devices Market Forecast (USD Billion), by Sub-Segment 1, 2018-2029
      Figure 77: Asia Pacific Medium and High Voltage Power Devices Market Forecast (USD Billion), by Sub-Segment 2, 2018-2029
      Figure 78: Asia Pacific Medium and High Voltage Power Devices Market Forecast (USD Billion), by Sub-Segment 3, 2018-2029
      Figure 79: Asia Pacific Medium and High Voltage Power Devices Market Forecast (USD Billion), by Others, 2018-2029
      Figure 80: Asia Pacific Medium and High Voltage Power Devices Market Forecast (USD Billion), by China, 2018-2029
      Figure 81: Asia Pacific Medium and High Voltage Power Devices Market Forecast (USD Billion), by India, 2018-2029
      Figure 82: Asia Pacific Medium and High Voltage Power Devices Market Forecast (USD Billion), by Japan, 2018-2029
      Figure 83: Asia Pacific Medium and High Voltage Power Devices Market Forecast (USD Billion), by Australia, 2018-2029
      Figure 84: Asia Pacific Medium and High Voltage Power Devices Market Forecast (USD Billion), by Southeast Asia, 2018-2029
      Figure 85: Asia Pacific Medium and High Voltage Power Devices Market Forecast (USD Billion), by Rest of Asia Pacific, 2018-2029
      Figure 86: Middle East & Africa Medium and High Voltage Power Devices Market Value Share (%), By Segment 1, 2022 & 2029
      Figure 87: Middle East & Africa Medium and High Voltage Power Devices Market Forecast (USD Billion), by Sub-Segment 1, 2018-2029
      Figure 88: Middle East & Africa Medium and High Voltage Power Devices Market Forecast (USD Billion), by Sub-Segment 2, 2018-2029
      Figure 89: Middle East & Africa Medium and High Voltage Power Devices Market Value Share (%), By Segment 2, 2022 & 2029
      Figure 90: Middle East & Africa Medium and High Voltage Power Devices Market Forecast (USD Billion), by Sub-Segment 1, 2018-2029
      Figure 91: Middle East & Africa Medium and High Voltage Power Devices Market Forecast (USD Billion), by Sub-Segment 2, 2018-2029
      Figure 92: Middle East & Africa Medium and High Voltage Power Devices Market Forecast (USD Billion), by Sub-Segment 3, 2018-2029
      Figure 93: Middle East & Africa Medium and High Voltage Power Devices Market Forecast (USD Billion), by Others, 2018-2029
      Figure 94: Middle East & Africa Medium and High Voltage Power Devices Market Value Share (%), By Segment 3, 2022 & 2029
      Figure 95: Middle East & Africa Medium and High Voltage Power Devices Market Forecast (USD Billion), by Sub-Segment 1, 2018-2029
      Figure 96: Middle East & Africa Medium and High Voltage Power Devices Market Forecast (USD Billion), by Sub-Segment 2, 2018-2029
      Figure 97: Middle East & Africa Medium and High Voltage Power Devices Market Forecast (USD Billion), by Sub-Segment 3, 2018-2029
      Figure 98: Middle East & Africa Medium and High Voltage Power Devices Market Forecast (USD Billion), by Others, 2018-2029
      Figure 99: Middle East & Africa Medium and High Voltage Power Devices Market Forecast (USD Billion), by GCC, 2018-2029
      Figure 100: Middle East & Africa Medium and High Voltage Power Devices Market Forecast (USD Billion), by South Africa, 2018-2029
      Figure 101: Middle East & Africa Medium and High Voltage Power Devices Market Forecast (USD Billion), by Rest of Middle East & Africa, 2018-2029 
      List of Tables
      Table 1: Global Medium and High Voltage Power Devices Market Revenue (USD Billion) Forecast, by Segment 1, 2018-2029
      Table 2: Global Medium and High Voltage Power Devices Market Revenue (USD Billion) Forecast, by Segment 2, 2018-2029
      Table 3: Global Medium and High Voltage Power Devices Market Revenue (USD Billion) Forecast, by Segment 3, 2018-2029
      Table 4: Global Medium and High Voltage Power Devices Market Revenue (USD Billion) Forecast, by Region, 2018-2029
      Table 5: North America Medium and High Voltage Power Devices Market Revenue (USD Billion) Forecast, by Segment 1, 2018-2029
      Table 6: North America Medium and High Voltage Power Devices Market Revenue (USD Billion) Forecast, by Segment 2, 2018-2029
      Table 7: North America Medium and High Voltage Power Devices Market Revenue (USD Billion) Forecast, by Segment 3, 2018-2029
      Table 8: North America Medium and High Voltage Power Devices Market Revenue (USD Billion) Forecast, by Country, 2018-2029
      Table 9: Europe Medium and High Voltage Power Devices Market Revenue (USD Billion) Forecast, by Segment 1, 2018-2029
      Table 10: Europe Medium and High Voltage Power Devices Market Revenue (USD Billion) Forecast, by Segment 2, 2018-2029
      Table 11: Europe Medium and High Voltage Power Devices Market Revenue (USD Billion) Forecast, by Segment 3, 2018-2029
      Table 12: Europe Medium and High Voltage Power Devices Market Revenue (USD Billion) Forecast, by Country, 2018-2029
      Table 13: Latin America Medium and High Voltage Power Devices Market Revenue (USD Billion) Forecast, by Segment 1, 2018-2029
      Table 14: Latin America Medium and High Voltage Power Devices Market Revenue (USD Billion) Forecast, by Segment 2, 2018-2029
      Table 15: Latin America Medium and High Voltage Power Devices Market Revenue (USD Billion) Forecast, by Segment 3, 2018-2029
      Table 16: Latin America Medium and High Voltage Power Devices Market Revenue (USD Billion) Forecast, by Country, 2018-2029
      Table 17: Asia Pacific Medium and High Voltage Power Devices Market Revenue (USD Billion) Forecast, by Segment 1, 2018-2029
      Table 18: Asia Pacific Medium and High Voltage Power Devices Market Revenue (USD Billion) Forecast, by Segment 2, 2018-2029
      Table 19: Asia Pacific Medium and High Voltage Power Devices Market Revenue (USD Billion) Forecast, by Segment 3, 2018-2029
      Table 20: Asia Pacific Medium and High Voltage Power Devices Market Revenue (USD Billion) Forecast, by Country, 2018-2029
      Table 21: Middle East & Africa Medium and High Voltage Power Devices Market Revenue (USD Billion) Forecast, by Segment 1, 2018-2029
      Table 22: Middle East & Africa Medium and High Voltage Power Devices Market Revenue (USD Billion) Forecast, by Segment 2, 2018-2029
      Table 23: Middle East & Africa Medium and High Voltage Power Devices Market Revenue (USD Billion) Forecast, by Segment 3, 2018-2029
      Table 24: Middle East & Africa Medium and High Voltage Power Devices Market Revenue (USD Billion) Forecast, by Country, 2018-2029
      Research Process

      Data Library Research are conducted by industry experts who offer insight on industry structure, market segmentations technology assessment and competitive landscape (CL), and penetration, as well as on emerging trends. Their analysis is based on primary interviews (~ 80%) and secondary research (~ 20%) as well as years of professional expertise in their respective industries. Adding to this, by analysing historical trends and current market positions, our analysts predict where the market will be headed for the next five years. Furthermore, the varying trends of segment & categories geographically presented are also studied and the estimated based on the primary & secondary research.

      In this particular report from the supply side Data Library Research has conducted primary surveys (interviews) with the key level executives (VP, CEO’s, Marketing Director, Business Development Manager and SOFT) of the companies that active & prominent as well as the midsized organization

      FIGURE 1: DLR RESEARH PROCESS

      research-methodology1

      Primary Research

      Extensive primary research was conducted to gain a deeper insight of the market and industry performance. The analysis is based on both primary and secondary research as well as years of professional expertise in the respective industries.

      In addition to analysing current and historical trends, our analysts predict where the market is headed over the next five years.

      It varies by segment for these categories geographically presented in the list of market tables. Speaking about this particular report we have conducted primary surveys (interviews) with the key level executives (VP, CEO’s, Marketing Director, Business Development Manager and many more) of the major players active in the market.

      Secondary Research

      Secondary research was mainly used to collect and identify information useful for the extensive, technical, market-oriented, and Friend’s study of the Global Extra Neutral Alcohol. It was also used to obtain key information about major players, market classification and segmentation according to the industry trends, geographical markets, and developments related to the market and technology perspectives. For this study, analysts have gathered information from various credible sources, such as annual reports, sec filings, journals, white papers, SOFT presentations, and company web sites.

      Market Size Estimation

      Both, top-down and bottom-up approaches were used to estimate and validate the size of the Global market and to estimate the size of various other dependent submarkets in the overall Extra Neutral Alcohol. The key players in the market were identified through secondary research and their market contributions in the respective geographies were determined through primary and secondary research.

      Forecast Model

      research-methodology2